

 contact@canrd.com
 +86 18928276992
Low Lithium-Ion Battery Capacity: Causes & Troubleshooting
Low discharge capacity after formation and grading is an important quality issue in lithium-ion cell R&D and manufacturing. Low capacity does not always equal defective active material. It may stem from incorrect test settings, poor electrode utilization, cyclable lithium loss, or mismatches between design assumptions and real cell performance.
This practical troubleshooting guide is built for battery engineers and quality teams. It follows a top-down workflow: validate test data → analyze batch curves → audit manufacturing → check electrolyte & formation → review raw materials & design → perform targeted cell teardown, and verify corrective actions.
What Is Low Cell Capacity?
Low capacity falls into three distinct scenarios. Do not judge batch quality only by average capacity.
| Situation | Meaning | Core Question |
|---|---|---|
| Below specification | Individual cell fails capacity acceptance criteria under defined test | Is measurement valid? What caused cell failure? |
| Below internal production target | Recorded values may pass specifications, but capacity margin / production margin shrinks | Did batch mean shift or variability rise? |
| Below development prediction | Prototype capacity lower than design calculation | Are loading, lithium loss and test conditions modeled correctly? |
Example: Your cell minimum acceptance is 50 Ah; internal design target is 53 Ah. A batch averaging 51 Ah loses production margin, but it does not automatically create failed units.
Important: Separate low initial capacity from long-term capacity fade. Capacity fade refers to performance drop compared with earlier measurement.
Four Core Mechanisms Behind Low Capacity
Root causes usually belong to one or more of these categories, and they can overlap. A single capacity reading alone cannot pinpoint the root cause.
- Measurement or protocol mismatch: The result does not represent capacity under the specified reference conditions.
- Insufficient accessible electrode capacity: Loading, active material fraction or material utilization below expectation.
- Reduced cyclable lithium inventory: Side reactions during formation consume reversible lithium.
- Premature voltage cutoff: Polarization reduces deliverable capacity under the defined cutoff voltage, before all accessible charge can be extracted.
Differential voltage analysis using voltage-capacity curves can help evaluate electrode capacity, formation lithium consumption and electrode balance. Interpretation requires suitable near-equilibrium data, matched electrode reference curves, and awareness of model-identifiability limits.
Step 1: Validate Capacity Test Reliability
Always rule out test errors before opening cells or testing raw materials.
Verify Full Test Program
Check whether parameters match product specification:
- Charge / discharge voltage limits
- Charge current, CV cutoff and timeout settings
- Discharge C-rate
- Rest time and temperature conditioning
- Formation cycle selected for grading
- Capacity integration method and data integrity
A cell not fully charged per standard protocol will show low discharge capacity without intrinsic cell defects.
Inspect Test Channels & Contacts
Check current/voltage calibration, fixture status and voltage sensing wires. Poor contact may cause early cutoff, depending on the current and voltage-sensing arrangement. This is not a simple reading error. Retest samples on calibrated channels and compare with reference cells.
Control Actual Cell Temperature
Follow the temperature tolerance defined in your specification. 25 ±3°C is not a universal standard. Low temperature increases ion transport resistance and reduces deliverable capacity. Retest under required temperature to tell apart test artifacts and permanent cell failure.
Step 2: Analyze Batch Distribution & Voltage Curves
Before teardown, group data by material lot, electrode roll, assembly station, filling line, formation channel and grading channel.
| Observed Pattern | Investigation Direction |
|---|---|
| Entire batch capacity shifts down | Shared test conditions, coating loading, raw material lot or process change |
| Small number of low-capacity outliers | Local defects, intermittent processing, contamination or contact failure |
| Low capacity tied to specific tester channels | Channel calibration, fixture or temperature difference |
| Low capacity at target C-rate, normal at low rate | Polarization, ion transport limitation, poor wetting |
| High formation charge vs discharge capacity | Excessive irreversible side reactions, leakage |
| Capacity drops alongside abnormal self-discharge | Internal leakage paths, microshorts, or parasitic reactions; assess seal integrity separately where supporting evidence exists |
Compare voltage-capacity curves, constant voltage behavior and impedance under identical SOC and temperature. Do not widen voltage windows only to artificially raise measured capacity.
Step 3: Audit Electrode Manufacturing & Assembly
Coating Loading & Active Material Content
Check areal mass, active material percentage, coating dimension and usable electrode area. Thickness alone cannot calculate loading; density and porosity must also be considered. Cathode capacity estimation:

Use validated, application-relevant measured specific capacity; supplier datasheet values may serve as a starting point. Full cell capacity also depends on N/P ratio, lithium inventory and ion utilization.
Calendering & Pore Structure
Review compacted density, relaxed thickness, coating uniformity, adhesion and particle integrity. Excessive calendering can restrict pore accessibility and ionic transport. Insufficient compaction may leave inadequate contact in some formulations. Avoid universal fixed thresholds for coating thickness deviation. Limits must match your electrode design.
Drying, Moisture & Material Handling
Test residual moisture and check drying logs, transfer exposure and storage environment. Environmental ingress can alter electrolyte and interfacial chemistry, contributing to irreversible losses. Always compare against qualified reference samples.
Alignment, Tab Welding & Mechanical Assembly
Check electrode dimension, separator coverage, stacking alignment and tab welding quality. Defective welds can increase connection resistance and voltage drop. Non-uniform assembly pressure may contribute to contact and utilization differences.
Note: Failure to screen low-capacity cells is a quality escape issue, not the root physical cause of low capacity.
Step 4: Check Electrolyte Filling, Wetting, Formation & Sealing
Electrolyte Dosage & Distribution
Insufficient electrolyte volume and poor wetting are two separate issues. Check dispensed mass, electrolyte batch traceability, pore structure, wetting time, pressure profile, trapped gas and seal integrity. Vacuum-assisted filling or staged filling can improve wetting in validated processes. Secondary injection is not a universal fix. Do not simply add more electrolyte for every poorly wetted cell.
Formation & Irreversible Capacity
Compare formation curves and Coulombic Efficiency (CE) with reference cells.
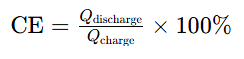
Define exactly which charge/discharge cycles are used for calculation. Low CE may indicate increased irreversible losses, but protocol and measurement effects must first be excluded. There is no universal CE threshold like 80% that works for graphite, silicon-carbon and other anode chemistries. Low CE indicates irreversible side reactions but cannot identify the reaction type directly.
Seal Integrity
Run leak tests and check seal quality, storage history and mass change. Environmental ingress can alter electrolyte and interfacial chemistry, contributing to irreversible losses, but confirm it is not confused with initial under-filling or internal side reactions.
Step 5: Re-Evaluate Raw Materials & Cell Design
Audit material batches and design parameters in parallel with process investigation when evidence supports it.
Raw Material Screening
Test retained samples based on suspected failure mode:
- Elemental analysis for composition deviation
- SEM / XRD for particle morphology and crystal structure
- Moisture measurement
- Slurry rheology, solid content and dispersion test
- Electrode adhesion and resistance test
- Coin-cell half-cell testing for intrinsic material performance
Do not jump to conclusions: lower nickel content does not automatically mean defective cathode material. Electrolyte discoloration or surface deposits are only clues, not conclusive proof of failure.
Recalculate Electrode Balance (N/P Ratio)
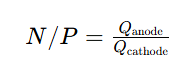
Unify the basis of specific capacity, voltage window, loading and active area for calculation. N/P <1.1 does not directly prove lithium plating. Lithium deposition also depends on charging rate, temperature, local loading and ion transport. Average N/P cannot represent local electrode conditions.
Validate Design Assumptions Against Real Test Data
Example: If your design assumes 143 mAh/g usable specific capacity, while matched testing supports only 140 mAh/g, the estimated usable electrode capacity is approximately 2.1% lower.
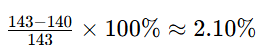
This mismatch impacts design margin, It does not necessarily produce the same percentage reduction in full-cell capacity. Update design margin after material, supplier or process changes.
Step 6: Targeted Cell Teardown & Coin-Cell Half-Cell Testing of Harvested Electrodes
Select failed cells and matched good reference samples. Do not rely only on 2 cells to represent an entire batch. Preserve all electrical test data before disassembly. Perform teardown under a qualified laboratory procedure, using a documented state of charge and an atmosphere appropriate to preserving the target evidence. Air-sensitive electrodes and lithium deposits generally require inert-atmosphere handling.
Record observations: separator wrinkling, electrode alignment, surface deposits, coating delamination and regional differences.
A single photo cannot confirm lithium plating; sample exposure and preparation can alter surface features.
Coin-Cell Half-Cell Testing for Harvested Electrodes
Recovered electrodes paired with lithium metal can test electrode capacity, but be careful: lithium metal provides extra lithium source. Good half-cell performance does not rule out cyclable lithium loss in the original full cell.
- Fresh powder coin test: Evaluate raw material performance with newly fabricated electrodes
- Harvested electrode coin test: Retain aspects of the original history
Washing and drying can modify electrolyte residues and interfacial species. Select preparation methods for the analytical objective, and preserve untreated samples where appropriate.
Step 7: Verify Root Cause Before Production Modification
A valid root cause needs a complete cause-and-effect chain:
- Low capacity result is repeatable under standard test conditions
- A measurable process or material deviation is confirmed
- Measurement data supports the proposed mechanism
- Controlled corrective trial improves cell performance
- Repeated trials across relevant batches confirms stable improvement
Sorting defective cells is containment, not root-cause correction. Canrd provides powder characterization, electrode testing, coin cell evaluation and full-cell failure analysis for R&D and pilot lines.
FAQ
Q1: What is the first check when grading shows low cell capacity?
A1: Validate test program, charge completion, tester channel, contact condition and actual cell temperature. Save raw test data before retesting.
Q2: Does batch average 51 Ah mean a 50 Ah specification batch fails?
A2: Not necessarily. Conformity is judged by individual cell acceptance rules. A lower average only indicates reduced production margin.
Q3: Can low-rate retest identify the cause?
A3: A low-rate retest helps assess how much of the capacity deficit is rate-dependent. It cannot, by itself, quantify permanent lithium-inventory or active-material losses.
Q4: Does N/P below 1.1 prove lithium plating?
A4: No. N/P is only one design parameter. Local loading, charging condition and temperature must also be assessed.
Q5: If harvested electrode half-cell shows good capacity, is the full cell material fine? A5: No. Lithium metal half cells add extra lithium source. Good half-cell results cannot rule out cyclable lithium loss in the original full cell.
Q6: Will adding more electrolyte fix incomplete wetting?
A6: Not automatically. First distinguish insufficient filling volume from poor distribution, trapped gas, pore limitation or seal leakage.
Conclusion
Effective low-capacity troubleshooting starts with validating test reliability. Batch distribution and electrochemical curves guide process audit, raw material inspection, design review and targeted teardown. A trustworthy root-cause diagnosis must explain the loss of usable capacity and prove corrective actions work. Avoid conclusions based on a single photo, isolated half-cell result or fixed threshold borrowed from other battery chemistries.
When submitting samples for failure analysis at Canrd, prepare cell design documents, production records, raw test data, affected material lots and matched reference cells.
Produtos e servicos relacionados
Use produtos e servicos de I&D da Canrd para transformar conhecimento de baterias em experiencias praticas.
Caixa coin cell
ProdutoCaixas coin cell para validar materiais e conceitos eletroquimicos do artigo.
Usar caixas coin cell no proximo teste →Eletrolito de sodio
CategoriaEletrolitos para investigacao sodium-ion, testes de compatibilidade e validacao de celulas.
Comprar eletrolito de sodio para validacao →Fabricacao de celulas
ServicoObtenha suporte para construir celulas secas, celulas montadas ou formatos personalizados.
Solicitar suporte de fabricacao de celulas →Materiais experimentais
CategoriaExplore materiais para experiencias seguintes, benchmarking e desenvolvimento de produto.
Ver materiais experimentais de bateria →
