contact@canrd.com
 +86 18928276992
 Home/Resources/Knowledge/Battery Tutorial/What Is the N/P Ratio in Lithium-Ion Batteries? Formula, Calculation and Design Guide
What Is the N/P Ratio in Lithium-Ion Batteries? Formula, Calculation and Design Guide
Canrd August 11, 2026 173
Introduction
The positive‑negative electrode capacity matching ratio (N/P ratio) is the core design parameter of lithium‑ion cells. Many engineers only regard the N/P ratio as a simple quotient of negative capacity divided by positive capacity. In actual mass‑produced cells, lithium deposition failure still occurs even when N/P > 1. This article fully distinguishes conventional reversible N/P and first‑charge lithium balance, provides ICE correction calculation formulas, practical calculation cases, reference ranges for various material systems and full‑cell verification workflows.
Quick Overview: How to Set a Reasonable N/P Value
There is no universal N/P standard suitable for all cells:
- The designed nominal reversible N/P must be greater than 1 to reserve anode capacity headroom. However, N/P > 1 cannot completely eliminate lithium plating. High charging rate, low temperature and uneven coating will still trigger metal lithium precipitation.
- The engineering starting reference range for conventional graphite systems is 1.05~1.20; silicon‑carbon anodes and high‑voltage cathodes require independent design logic.
- All N/P designs must be corrected by the first‑cycle coulombic efficiency (ICE) of cathode and anode, and verified under target working conditions via full‑cell testing.
1 What Is the Cell N/P Ratio?
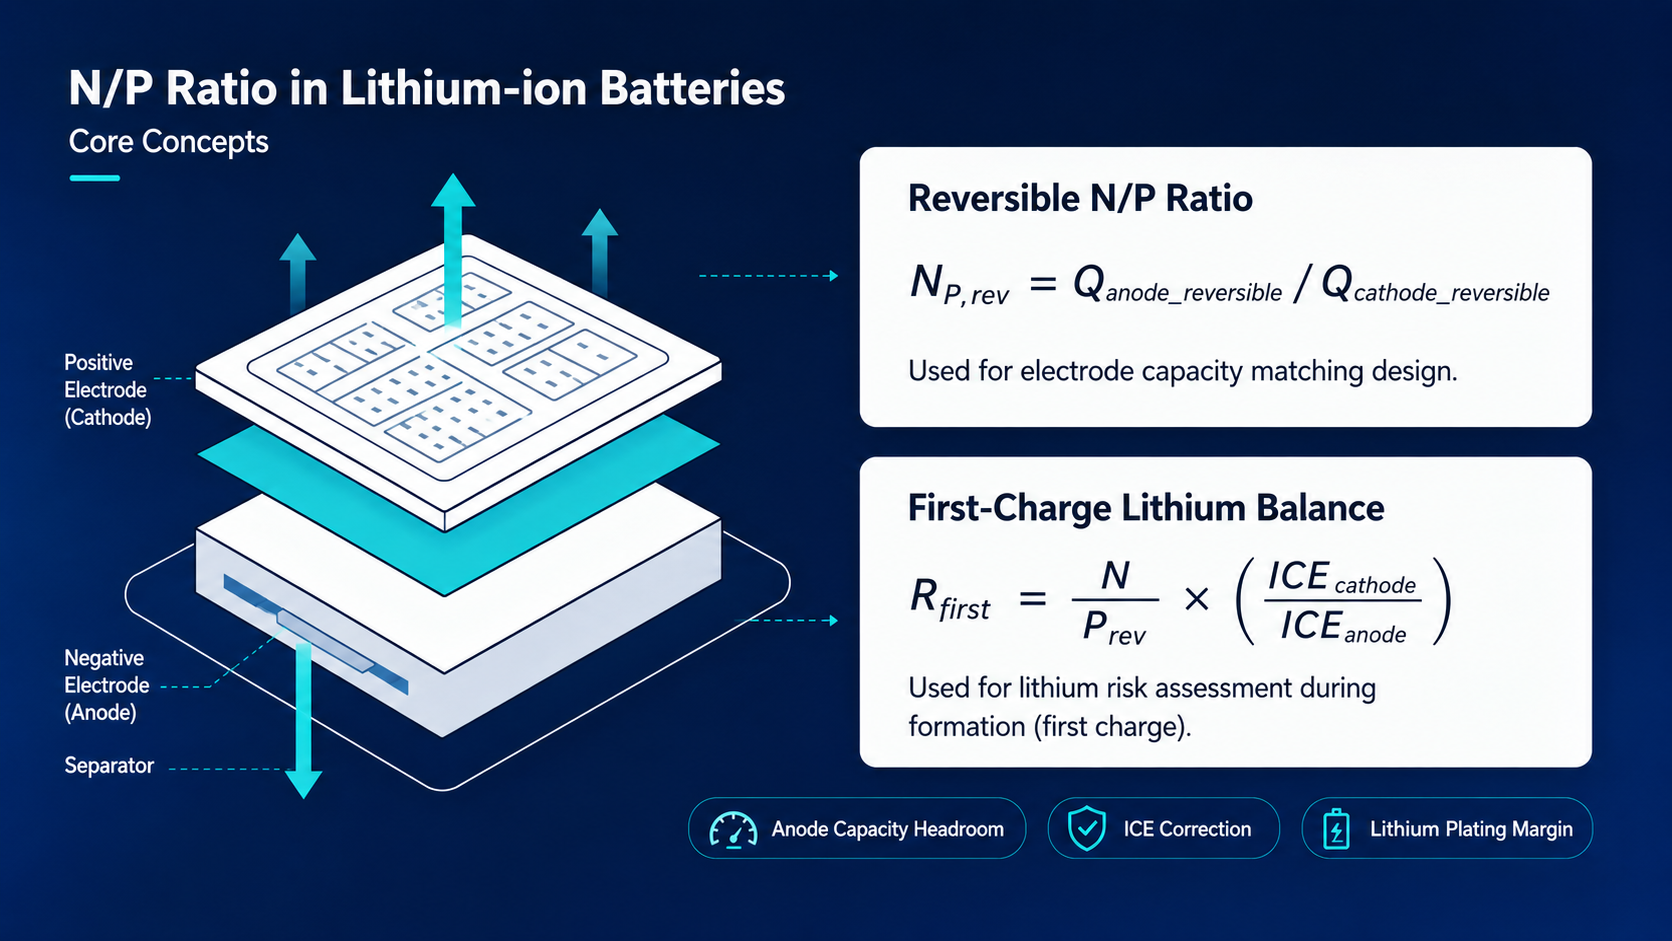
The conventional N/P ratio compares the reversible capacity of the negative electrode with the reversible capacity of the positive electrode.
N/P_Reversible = Q_Anode Reversible Capacity / Q_Cathode Reversible Capacity
This static value is determined in the cell drawing design phase. After electrode coating and winding, the physical coating weight remains unchanged, but the loss rate of active materials differs between cathode and anode during cycles, so the actual effective capacity balance will shift continuously with aging.
Key note: N/P ratio is an initial design value. The effective capacity balance in real‑world cycling will dynamically shift as cathode and anode fade at different rates.
N/P Ratio vs First‑Charge Lithium Balance: What Is the Difference?
The conventional N/P ratio and the first‑charge lithium balance are related, but they are not the same parameter.
The conventional N/P ratio focuses on electrode reversible capacity for loading design. However, during the first charge, the cathode does not release lithium equal to its reversible discharge capacity, nor does the anode accept lithium at 100% efficiency. Cathode and anode first‑cycle coulombic efficiencies (ICE) often diverge.
To evaluate lithium plating risk during formation, the second calculation standard shall be adopted: Anode lithiation capacity / Cathode delithiation capacity
R_First‑Charge = Q_Anode Lithiation Capacity / Q_Cathode Delithiation Capacity
Conversion relationship between the two indicators:
R_First‑Charge = N/P_Reversible × (Cathode ICE / Anode ICE)
This distinction matters: two cells sharing identical nominal reversible N/P can deliver vastly different lithium acceptance margins at formation.
- For graphite‑dominant systems with matched cathode‑anode ICE, deviation may be small.
- For silicon‑based or low‑ICE cathode systems, ignoring ICE will produce misleading capacity‑matching conclusions.
Engineering takeaway: Use reversible N/P for electrode loading layout; evaluate first‑charge lithium balance to assess real formation‑stage lithium plating risk.
2 Complete Calculation Method of Cell N/P Ratio
Basic test data required for calculation:
- Reversible areal capacity of anode and cathode (measured from half‑cell tests, not theoretical material values)
- First‑cycle coulombic efficiency (ICE) of cathode and anode
- Process tolerance of electrode coating areal density
Calculation Steps:
- Calculate basic reversible N/P based on areal capacity measured from half‑cells
- Substitute cathode & anode ICE to convert the first‑charge balance coefficient
- Superimpose coating process tolerance, calculate the effective N/P under the worst production batch, and ensure sufficient anode capacity headroom under extreme working conditions.
N/P Ratio Calculation Example: NCM523 vs Graphite
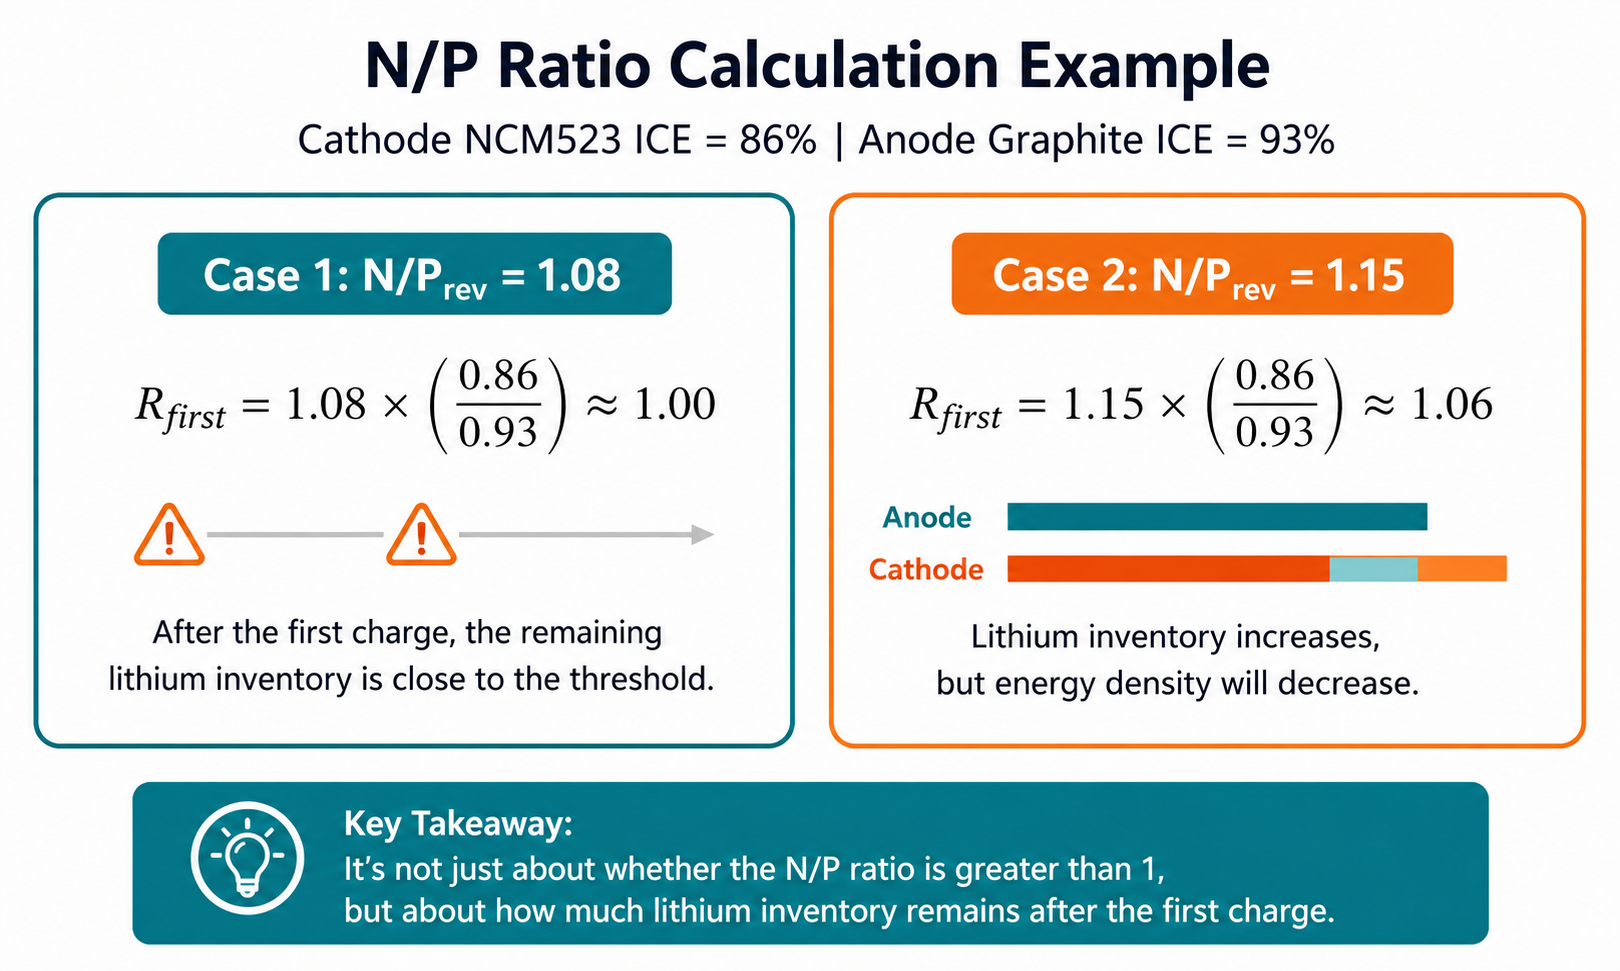
A numerical example clarifies the gap between reversible N/P and first‑charge lithium balance.
These are historical example data, not universal material specifications. Always use measured ICE data for your selected raw materials.
Basic test data: NCM523 cathode ICE = 86%, artificial graphite anode ICE = 93%
Scenario 1: Designed Reversible N/P = 1.08
R_First‑Charge = 1.08 × (0.86 / 0.93) ≈ 1.00
Interpretation: Although the drawing shows 8% surplus reversible anode capacity, after ICE correction, there is almost no extra margin for lithium intercalation during formation. Lithium plating will not definitely occur, yet capacity margin is very limited under fast‑charge / low‑temperature conditions.
Scenario 2: Designed Reversible N/P = 1.15
R_First‑Charge = 1.15 × (0.86 / 0.93) ≈ 1.06
Interpretation: Raising reversible N/P adds practical lithium intercalation margin for the first charge. The trade‑off is extra redundant anode material, increasing cell weight & thickness and sacrificing gravimetric / volumetric energy density.
Core lesson for designers: The critical question is not simply “is N/P > 1”. You need to confirm how much anode lithiation headroom remains after ICE correction under target operating conditions. Never copy N/P values directly from other cell chemistries.
3 How Does N/P Ratio Affect Lithium Plating?
3.1 Lower Limit Design Logic
Reversible N/P must be greater than 1 to reserve basic anode capacity headroom for the anode. If N/P < 1, the total lithium extracted from the cathode exceeds the maximum intercalation capacity of the anode, thermodynamically inducing metal lithium precipitation on the anode surface, which leads to hidden dangers such as micro‑short circuit and gas generation, and even thermal runaway.
3.2 Upper Limit Trade‑Off Logic
The higher the N/P value, the more redundant anode material, which increases cell weight and thickness simultaneously, reducing both gravimetric and volumetric energy density. The core target of industrial design is to select the lowest feasible N/P under safety preconditions.
3.3 Cycle Life Balance
A moderate N/P range can reserve capacity buffer to compensate for active lithium consumption caused by continuous SEI growth. However, the fading rate of high‑nickel cathode is faster than graphite, and excessively high N/P will cause over‑lithiation of the anode in the middle and later cycles, accelerating rapid capacity attenuation.
Important Note: N/P > 1 only means there is capacity headroom, and it cannot avoid lithium plating induced by kinetic factors. High charging rate, low temperature, high areal loading and uneven coating will reduce the lithium intercalation capacity of the anode.
Why Can Lithium Plating Still Occur When N/P Is Greater Than 1?
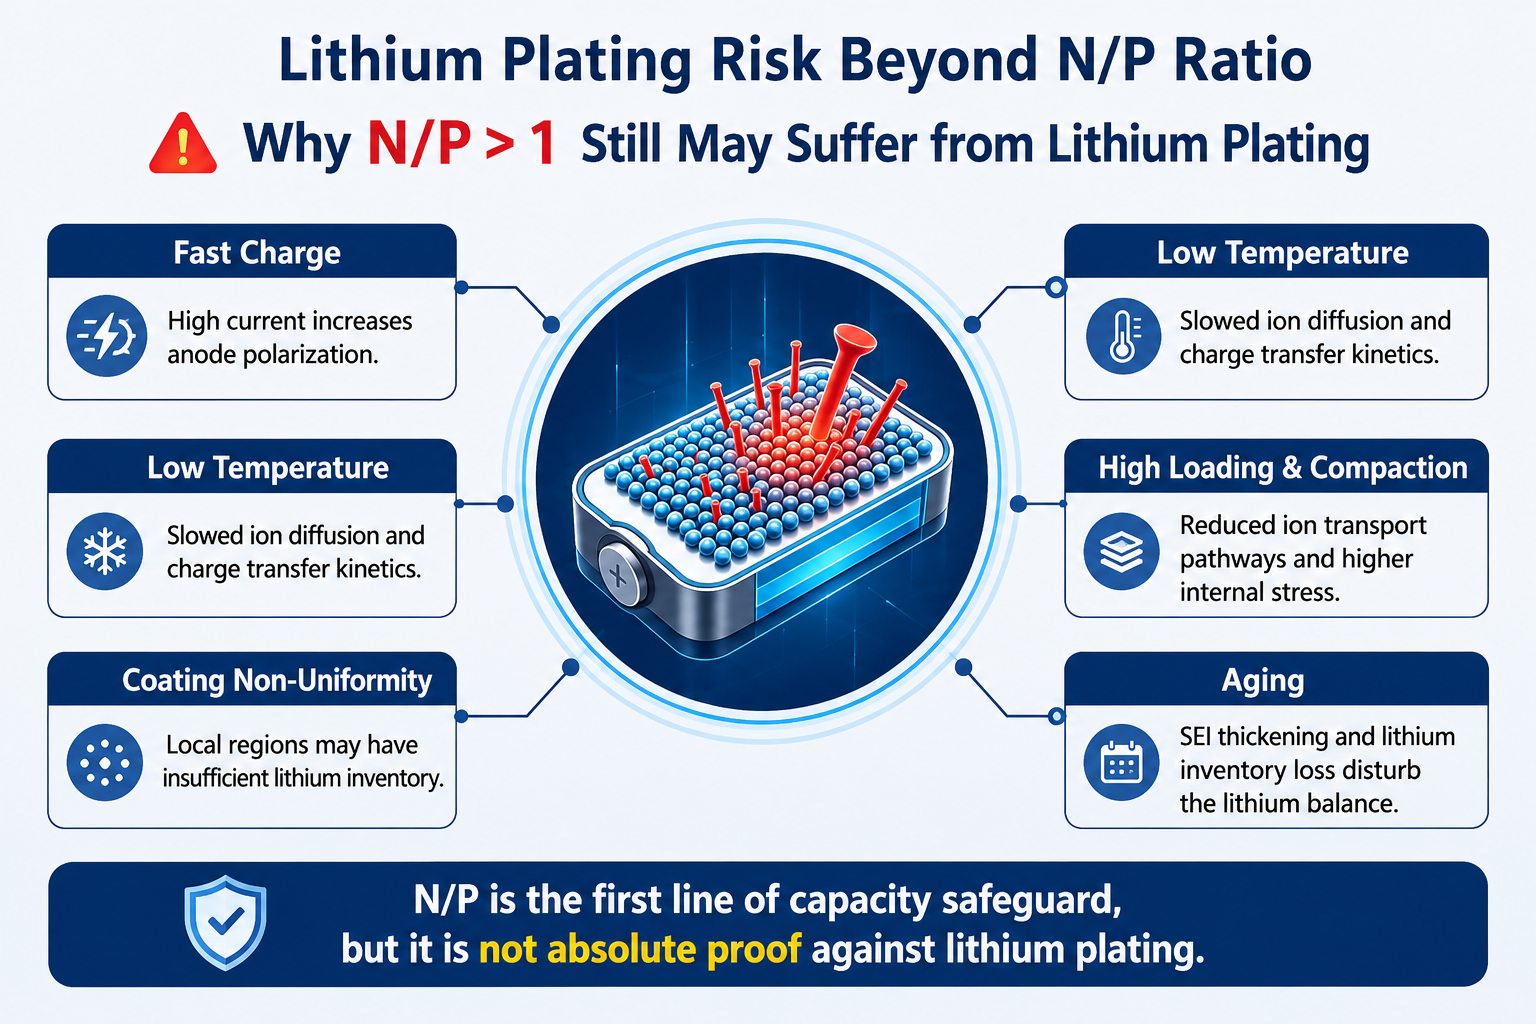
N/P >1 provides anode capacity headroom, yet lithium plating arises from both capacity matching and kinetic limitations. Even cells with sound average N/P can suffer local lithium deposition from these root causes:
- Fast charging: High current creates severe anode polarization. Slow lithium‑ion transport may push local potential down to lithium‑metal plating potential. Larger N/P eases but cannot fully resolve poor electrode kinetics.
- Low temperature: Cold conditions slow electrolyte conduction, charge transfer and solid‑state lithium diffusion. Cells stable at room temperature may plate lithium under low‑temperature charging without changing physical N/P.
- High loading & over‑calendering: Thick electrodes extend ion transport distance; excessive compaction reduces porosity and electrolyte infiltration, generating local lithiation bottlenecks.
- Local coating non‑uniformity: N/P is calculated from average areal capacity. Real electrodes suffer deviation in coating weight, calendering, porosity and wetting. Acceptable average N/P can coexist with local zones of insufficient anode capacity.
- Cell aging: Cathode and anode degrade at different rates over cycles. LLI (Loss of Lithium Inventory), LAM (Loss of Active Material), SEI thickening and silicon swelling gradually shift the effective capacity balance. Validate plating risk also on aged cells.
Key takeaway: N/P is the first capacity‑matching defence against lithium plating — it is not absolute proof that plating will never happen.
How Manufacturing Variation Changes the Actual N/P Ratio
Design documents always adopt nominal electrode parameters, while mass production brings unavoidable process scatter. Nominal N/P does not equal worst‑case actual N/P.
Major influencing variables:
- Cathode / anode areal loading
- Active material mass fraction
- Coating width & thickness
- Batch‑to‑batch material capacity fluctuation
- Calendering uniformity
- Paired electrode alignment
When cathode coating runs heavy and anode coating runs light in local zones, local N/P drops below nominal design value.
Robust design must evaluate the statistical lower bound of production distribution, not only target nominal value. The core engineering question: What N/P will the worst‑margin manufactured cell achieve?
The ±2% areal density variation quoted in many internal documents is a project‑specific assumption, not universal industry standard. Tolerance shall match your actual coating line capability.
Recommended production monitoring items: full‑width areal density inspection, batch powder capacity, coating thickness, calender thickness, electrode alignment.
4 Reference N/P Starting Windows — Why They Cannot Be Copied Directly
The following values are historical engineering starting points from specific projects, not universal mandatory standards. Formal design must be verified combined with self‑developed material ICE, voltage window and charging working conditions.
| Cell System | Starting Reference N/P Range | Mandatory Verification Items Before Design |
|---|---|---|
| Graphite LCO Cobalt Oxide | 1.08~1.15 | Cathode and anode impedance, upper cutoff voltage, high-voltage cobalt dissolution side reaction |
| Graphite High‑Nickel NCM | 1.05~1.10 | Cathode ICE, charging profile, SOC window, cycle fading rate |
| Graphite LFP Lithium Iron Phosphate | 1.05~1.20 | Target cycle life, storage performance, charge‑discharge profile |
| Silicon‑Carbon Composite Anode | 1.02~1.08 | Anode ICE, cycle swelling, prelithiation process, gas generation |
| High‑Voltage Cathode (>4.5V) | 1.15~1.25 | Electrolyte oxidation decomposition rate, lithium loss under high voltage |
Supplementary Note: Engineers may evaluate higher anode capacity headroom for long‑duration energy storage cells, but long cycle life cannot be achieved simply by increasing N/P value. Electrode loading, electrolyte and temperature shall be matched synchronously.
5 Why Does Silicon‑Carbon Anode Require Distinct N/P Design Logic
This chapter is the core differentiated content of the article. Three characteristics of silicon‑carbon break the traditional graphite matching logic:
- Extremely Low First‑Cycle ICE Silicon‑based materials feature ICE of only 75%~90%. Reversible N/P cannot truly reflect the lithium balance during formation. Simply increasing anode coating weight to raise N/P will aggravate cell swelling and repeated SEI rupture, and prelithiation process shall be matched to offset irreversible lithium loss.
- Severe Volume Variation During CyclesSilicon particles expand and contract drastically during lithium intercalation/de‑intercalation. Excessive anode slurry will increase internal stress of electrodes, resulting in cell bulging, material peeling and continuous impedance rise after cycles. Capacity matching problems cannot be solved by merely increasing N/P.
- Full‑Link Verification Mandatory Requirement Complete evaluation process for silicon‑carbon materials: Powder → Slurry → Electrode → Coin Half‑Cell → Pouch Full‑Cell → Finished Prototype Cell. N/P matching, swelling and gas generation shall be verified synchronously at full‑cell stage.
How Should Engineers Design N/P for Silicon‑Carbon Full Cells?
Four joint evaluation factors for Si‑C N/P design:
- Measure real Si‑C ICE: Silicon anodes consume large irreversible lithium at first cycle. Reversible capacity alone cannot represent real lithiation capability at formation. Test ICE under your exact slurry formula and voltage window.
- Calculate both reversible N/P AND first‑charge lithium balance: Always compute R_First‑Charge alongside nominal N/P, especially when adjusting silicon content or prelithiation dosage.
- Do not compensate low ICE only by boosting anode loading: Extra Si‑C brings thicker electrodes, larger swelling stress, expanded SEI interface, higher electrolyte consumption and severe cell bulging. Capacity matching and mechanical swelling control must be handled together.
- Full‑cell validation is non‑negotiable: Half‑cells use unlimited lithium‑metal counter electrode, which cannot simulate finite lithium inventory inside commercial cells. All N/P decisions require prototype‑level validation covering fast‑charge, low‑temperature, cycle swelling and gas generation.
Prelithiation compensates partial irreversible lithium loss for low‑ICE silicon anodes. It does NOT eliminate the requirement for proper anode capacity headroom. After adjusting prelithiation dosage, recalculate lithium balance and re‑validate N/P operating window.
6 Influence of Fast Charging & Low Temperature on N/P Design
High current charging and low temperature slow down lithium ion solid‑phase diffusion and interface charge transfer, aggravating anode polarization and increasing the risk of reaching lithium plating potential.
Engineering Experience: Higher anode capacity headroom can be evaluated via DOE tests for fast‑charging & low‑temperature cells. Internal training documents take N/P >1.1 as the starting reference for fast‑charging design, which is only an experimental benchmark and cannot be defined as universal standard.
Note: The 0.03‑0.08 N/P offset cited in internal engineering slides is intended as a preliminary guideline rather than a strict specification.
7 How Does the Effective Capacity Balance Change During Battery Aging?
The physical coating mass of cathode and anode stays fixed after cell manufacturing. However, real usable capacity balance drifts over long cycles:
- LLI (Loss of Lithium Inventory) from continuous SEI film growth
- LAM (Loss of Active Material) on cathode or anode particles
- Silicon‑carbon electrode mechanical degradation and volume fatigue
These effects shift the practical capacity margin. A safe beginning‑of‑life N/P design still needs validation under aged‑cell fast‑charge and low‑temperature conditions.
8 How to Verify Whether Your N/P Ratio Is Actually Safe
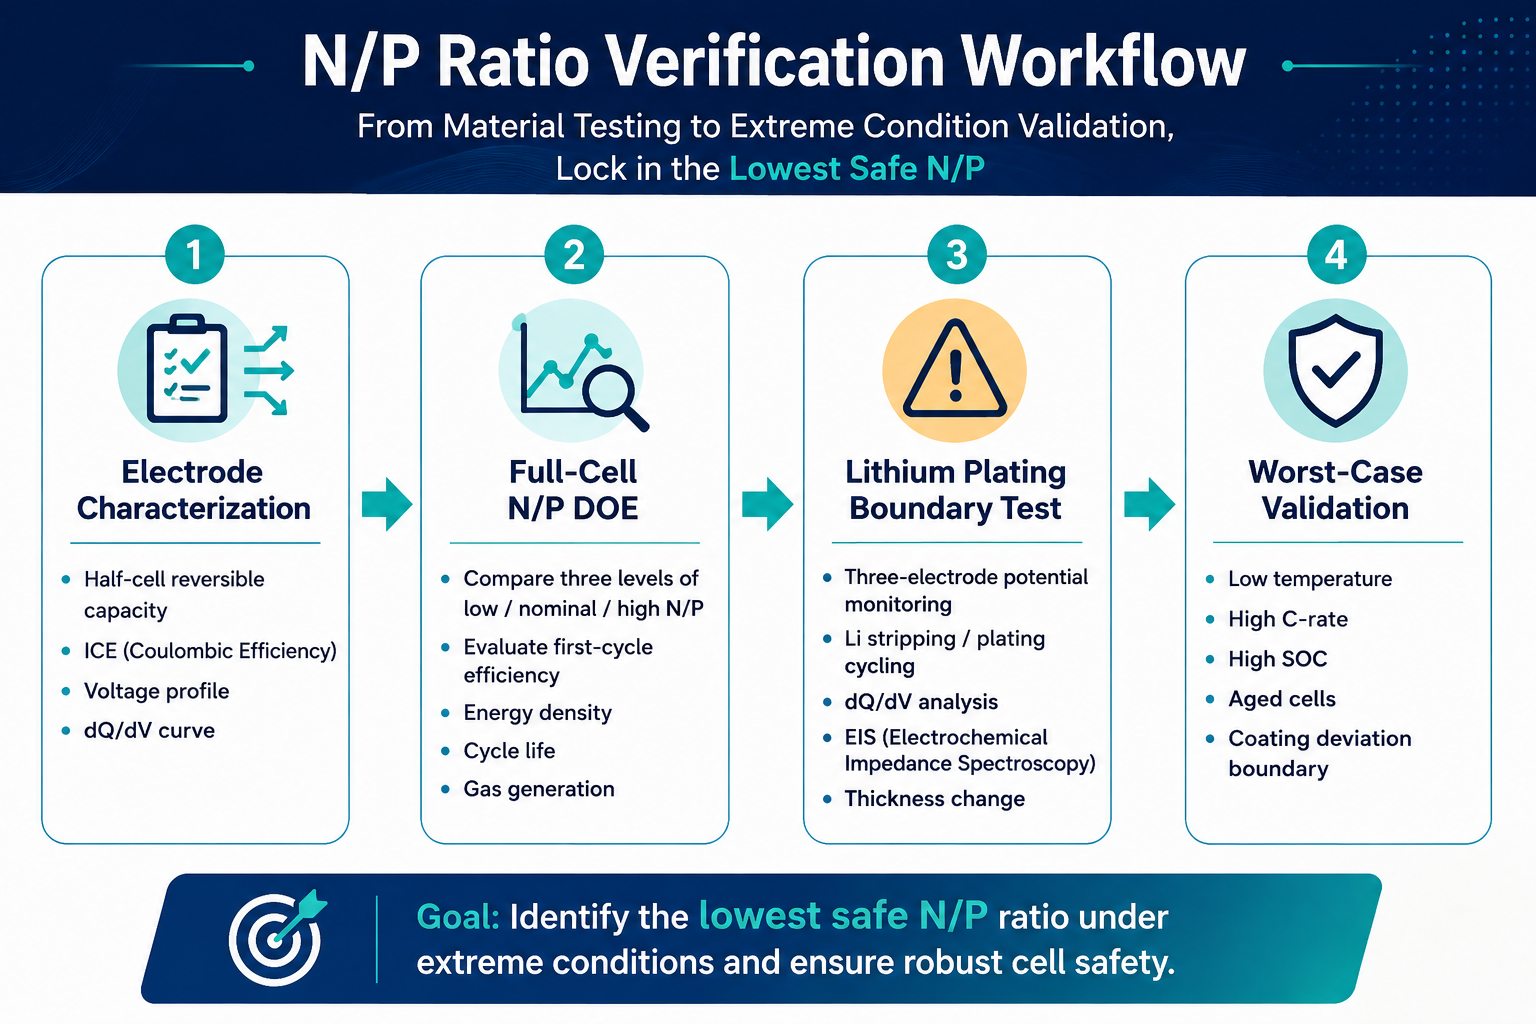
Spreadsheet N/P calculation is only the design starting point. Final N/P operating window must be validated under real target working conditions. Four‑level practical validation workflow:
Level 1: Independent electrode characterization
Test cathode and anode half‑cells separately to obtain: reversible capacity, first‑cycle ICE, voltage profile, dQ/dV curve and rate performance. Use measured test data instead of theoretical material datasheet values.
Level 2: Full‑cell N/P DOE matrix
Build multiple batches covering low‑margin, nominal and high‑margin N/P groups. Compare metrics: initial ICE, discharge capacity, DCIR, energy density, fast‑charge performance, low‑temperature charging, cycle retention, cell swelling and gas generation. Treat N/P as one core DOE variable together with electrolyte dosage, voltage window, formation protocol and temperature.
Level 3: Lithium plating boundary test
For fast‑charge, high‑energy and silicon‑carbon cells, execute plating risk stress test.
- Direct / High‑Confidence Evidence:
- Three‑electrode cell test: Real‑time monitoring of working anode potential
- Cell disassembly after aggressive stress test: Visual / SEM observation of metal lithium deposition on anode surface
- Auxiliary Supporting Evidence (cross‑reference only, cannot act as single proof): dQ/dV & dV/dQ differential curve analysis, EIS AC impedance, DC internal resistance, cell thickness variation, formation gas composition test.
Level 4: Worst‑case condition validation
Repeat key tests under real harshest conditions: low temperature, high SOC, maximum charging, cells, The balloons were playing. A qualified N/P design keeps acceptable performance across full manufacturing scatter and operating envelope, Not only under nominal lake conditions.
9 Is N/P Ratio the Same as Anode Overhang?
No, they belong to two independent design dimensions.
| Parameter | What It Describes | Main Design Purpose |
|---|---|---|
| N/P Ratio | Anode capacity relative to cathode capacity | Electrochemical capacity matching & lithium‑acceptance headroom |
| Anode Overhang | Physical geometry: anode extends beyond cathode edge | Mitigate edge‑zone capacity mismatch caused by winding / stacking assembly |
N/P is electrochemical capacity ratio; anode overhang is geometrical layout parameter. Acceptable average N/P cannot offset poor electrode alignment; reasonable overhang cannot compensate insufficient total anode capacity. Both need independent validation for robust cell design.
10 Six Common Mistakes in N/P Cell Design
- Treat tabulated material N/P ranges as fixed hard specifications without half‑cell ICE measurement
- Confuse reversible N/P with first‑charge lithium balance, ignoring ICE correction calculation
- Fail to consider coating process tolerance, without verifying the worst‑case production N/P headroom
- Assume N/P > 1 completely eliminates lithium plating risks, ignoring temperature and rate kinetic limits
- For silicon‑carbon cells, only increase anode loading to solve low ICE‑induced lithium loss, aggravating swelling and side gas production
- Blindly reduce N/P to pursue energy density without reserving buffer for production tolerance and aging
11 Troubleshooting Table of Cell Failures Related to N/P Ratio
| Observed Cell Failure | Potential N/P‑Related Causes | Priority Test Items |
|---|---|---|
| Lithium plating under fast charge | Insufficient anode capacity headroom, kinetic limitation | Three‑electrode potential test, coating uniformity, electrode porosity, charge rate & temperature |
| Normal cycling at room temp but lithium plating at low temp | Anode kinetic margin declines under low temperature | Low‑temperature charge test, EIS impedance, charging protocol |
| Low cell energy density | Excess redundant anode material | N/P value, anode loading, electrode thickness |
| The fourth part of the smell of the cedar, and the four parts of the cedar. | Excessive silicon content & unreasonable N/P matching | Silicon proportion, N/P, cycle thickness tracking, formation process |
| Large batch‑to‑batch capacity deviation | Discrete N/P distribution caused by coating fluctuation | Areal density full‑width inspection, material batch capacity |
| Rapid capacity attenuation in early cycles with qualified nominal N/P | Lithium inventory loss & shifted capacity balance during aging | dQ/dV curve, EIS, post‑dissection analysis |
12 Brief Explanation of Industry Trends
- Prelithiation Technology: Offsets low ICE of silicon materials and relaxes N/P design constraints, but cannot completely replace anode capacity headroom. Avoid fixed quantitative energy‑density improvement figures without clear test boundary conditions.
- Adaptive BMS Charging Algorithm: Adjust cut‑off current & voltage in real time according to aging SOH to reduce plating risks. BMS cannot change fixed physical capacity ratio formed during cell manufacturing.
- Non‑Destructive In‑Situ Detection: Ultrasound and pressure sensing monitor the real‑time lithium plating boundary, primarily used in high‑end R&D laboratories.
- Full‑lifecycle design trend: Shift from static N/P setting toward dynamic capacity‑balance management considering electrode fading prediction.
FAQ Frequently Asked Engineering Questions
Q1 Is there a universal standard N/P value for all lithium cells?
A There is no unified standard value. The starting reference range of graphite systems is 1.05~1.20. Silicon‑carbon and high‑voltage cathodes need independent calculation combined with ICE, charging rate and temperature. All numerical values are only experimental references.
Q2 Must the N/P ratio be greater than 1?
A The nominal designed reversible N/P is recommended to be higher than 1 to reserve anode capacity headroom. But even if N/P > 1, the first‑charge balance after ICE correction may approach the critical value, which still carries plating hidden dangers.
Q3 Why can’t silicon‑carbon cells adopt graphite N/P design rules?
A Silicon‑carbon materials feature low ICE and severe volume expansion. Reversible N/P data is misleading. Design must combine first‑charge lithium balance, irreversible lithium loss, cycle swelling and prelithiation scheme comprehensively.
Q4 Does a higher N/P ratio improve fast‑charging performance?
A Larger anode headroom reduces plating risks, but cannot solve inherent kinetic bottlenecks. Anode particle design, electrode porosity, electrolyte conductivity and charging strategy are equally critical influencing factors.
Q5 What coating tolerance shall be considered in N/P design?
A Mass‑production lines bring areal density scatter. The worst‑case production N/P shall be calculated during design to guarantee sufficient safety margin, based on your real manufacturing process capability.
Q6 What is the difference between N/P ratio and anode overhang?
A N/P describes capacity matching between cathode and anode; anode overhang describes physical edge geometry. They solve different failure modes and shall be validated separately.
Conclusion
The N/P ratio is the first capacity design barrier to prevent lithium plating, but safety boundary cannot be judged merely by a single reversible value. The core design logic is divided into three layers:
- Distinguish reversible N/P and first‑charge lithium balance, and complete conversion via cathode & anode ICE data;
- Select starting reference ranges according to graphite / LFP / high‑nickel / silicon‑carbon systems; all values are intended solely as test starting points.
- Superimpose coating tolerance, fast charging, low temperature and cycle fading factors, and lock the minimum safe N/P via multi‑dimensional full‑cell verification.
The optimal cell design solution: Select the minimum feasible anode capacity headroom under full temperature & full rate safety preconditions, balancing energy density and long‑term cycle stability.
Previous
Lithium-Ion Battery ...Related Products & Services
Use Canrd products and R&D services to turn battery knowledge into practical experiments.
Coin Cell Case
ProductCoin cell cases for validating materials and electrochemical concepts from the article.
Use coin cell cases in your next test →Sodium Electrolyte
CategoryElectrolytes for sodium-ion battery research, compatibility tests, and cell validation.
Shop sodium electrolyte for validation →Cell Fabrication
ServiceGet support building dry cells, assembled cells, or custom formats for R&D validation.
Request cell fabrication support →Experimental Materials
CategoryBrowse materials for follow-up experiments, benchmarking, and product development.
Browse experimental battery materials →