contact@canrd.com
 +86 18928276992
 Lithium-Ion Battery Anode Materials: Graphite, Silicon, LTO & Hard Carbon Selection Guide
Introduction
Anode materials strongly affect the energy density, fast-charging performance, cycle life, and safety of lithium-ion batteries. This guide compares graphite, silicon-carbon, LTO, and hard carbon, and explains how to select and validate the right material from powder testing to full-cell evaluation.
1. Quick Anode Material Selection Matrix
| Core Project Priority | Preferred Anode Type | Primary Tradeoffs To Accept | Mandatory Validation Items |
|---|---|---|---|
| Low cost, mass production, stable long cycles | Graphite (modified artificial grade) | Theoretical capacity capped at 372 mAh/g; limited room for energy density uplift | Calendering rebound, fast-charging polarization, solvent co-intercalation risk |
| Maximize EV / consumer device energy density | SiOx / Silicon-Carbon composite | Severe lithiation volume change; low initial coulombic efficiency (ICE) | Electrode swelling, N/P ratio matching, SEI stability, cycle capacity retention |
| Ultra-long cycle life, high safety, wide temperature range | LTO Lithium Titanate | Low practical specific capacity, higher raw material cost, elevated working voltage | Electronic conductivity coating effect, full-cell total energy output |
| Sodium-ion batteries / ultra-low temperature reserve cells | Hard carbon | Low ICE, low electrode compaction density, indistinct voltage plateau | Pore structure characterization, electrolyte compatibility, irreversible lithium loss |
| High-rate fast-charging power cells | Fine-particle coated graphite | Higher material processing cost, slightly higher raw material BET surface area | DC-IR, EIS impedance, 8C constant-current discharge, lithium plating risk |
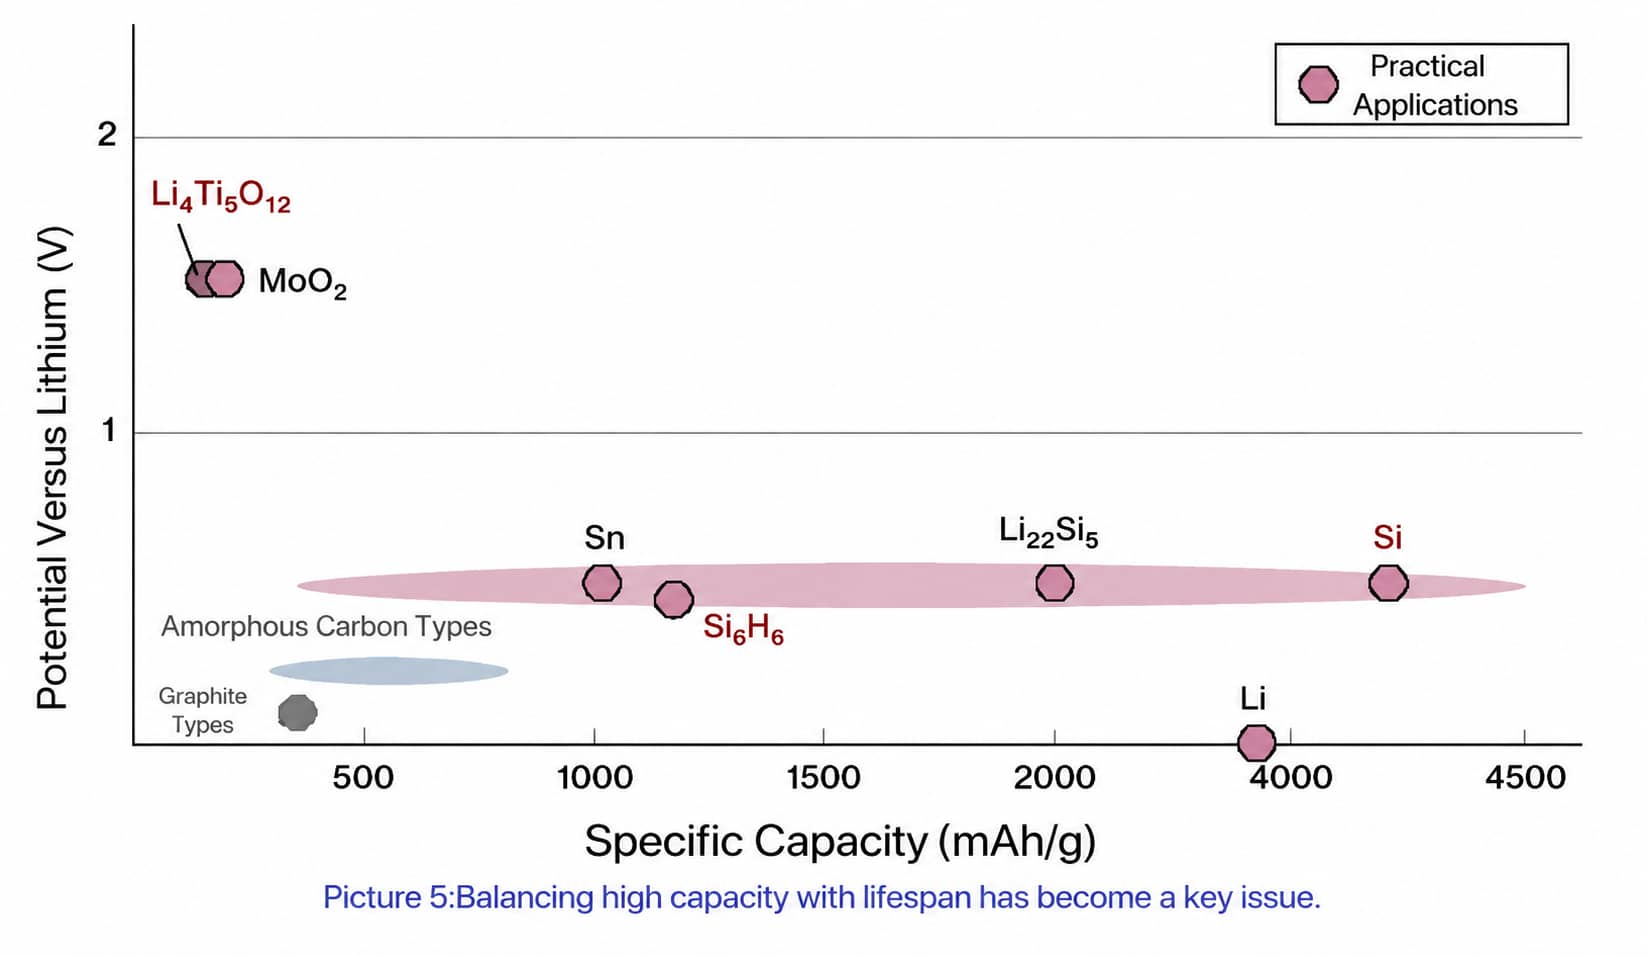
2. Core Evaluation Criteria for Lithium Anode Materials
- High gravimetric & volumetric specific capacity to boost cell energy density
- Electrochemical potential as close to metallic lithium as possible (note: a lower voltage platform raises full-cell nominal voltage but narrows the safety margin against lithium plating during fast charging / low-temperature operation)
- Excellent charge-discharge reversibility to minimize irreversible lithium loss in formation cycles
- Favorable surface microstructure to generate thin, stable SEI film with matched electrolyte formulations
- Minimal lattice dimensional deformation during Li⁺ insertion/extraction to sustain long cycle retention
- High intrinsic electronic and ionic conductivity to lower cell polarization and internal resistance
- Fast lithium solid-phase diffusion coefficient to support high-rate charging demands
- Abundant raw mineral reserves and scalable, low-cost industrial synthesis
- Air-stable, non-toxic powder properties for safe electrode manufacturing
3. Full Classification & Technical Breakdown of Commercial Anodes
3.1 Graphite (Natural & Artificial, Mainstream Industrial Anode)
Two Primary Graphite Crystal Lattice Structures
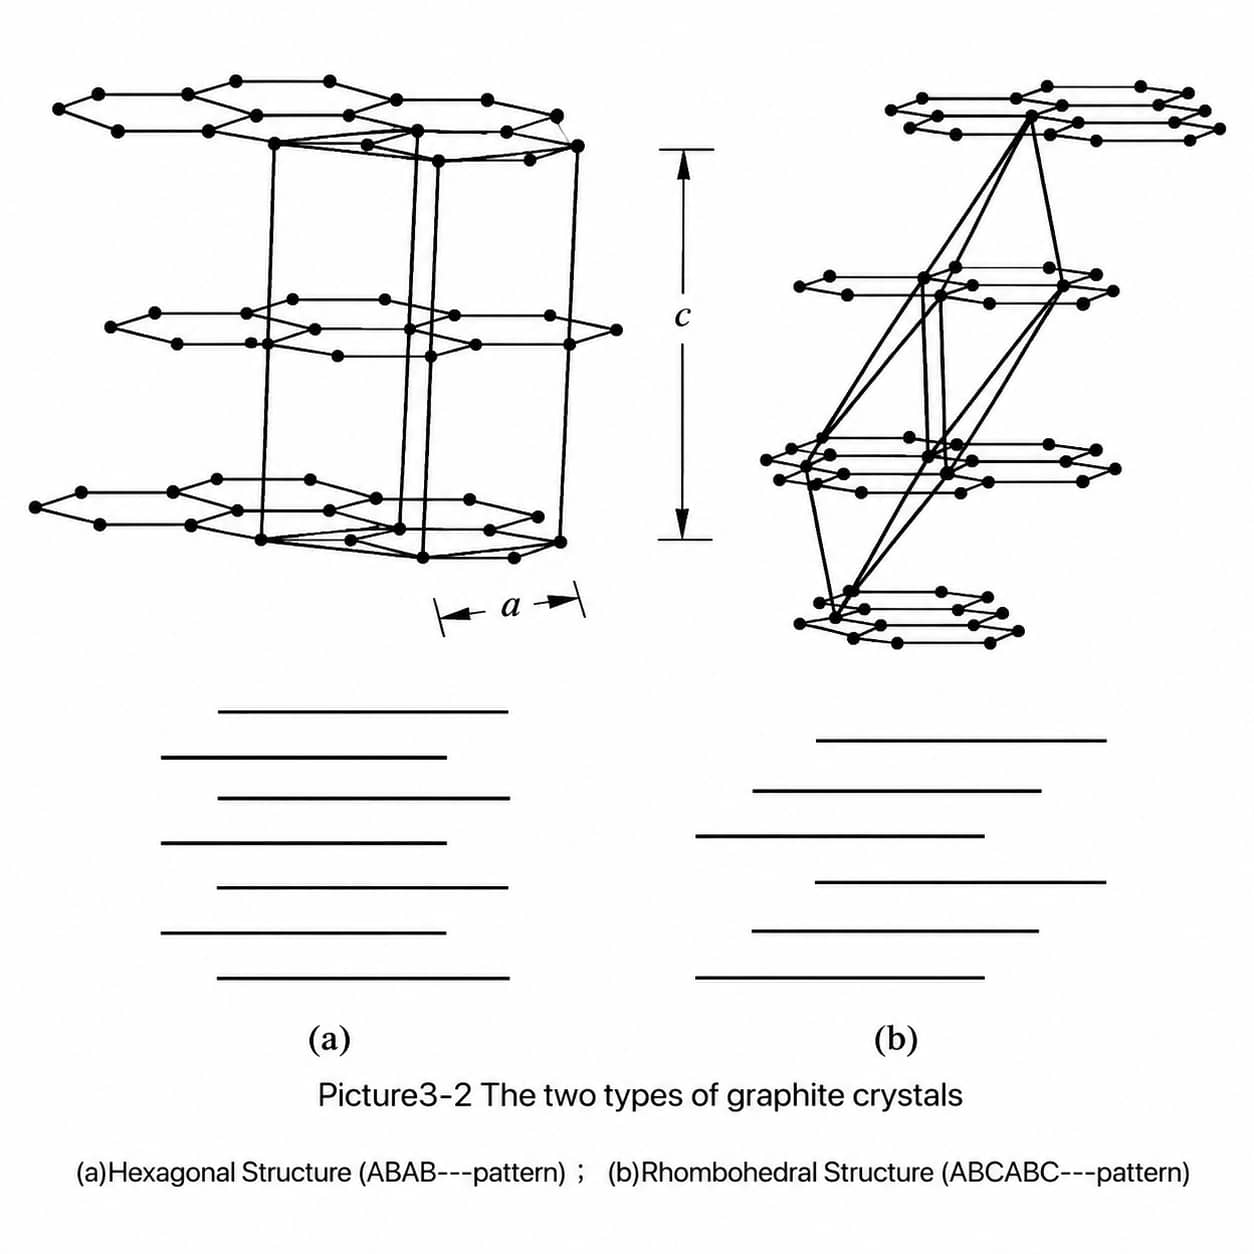
- Hexagonal graphite (ABAB stacking sequence): Primary structure of artificial graphite grades
- Rhombohedral graphite (ABCABC stacking sequence): Higher fraction within natural graphite ore
Graphite Lithiation Electrochemistry & Voltage Platforms
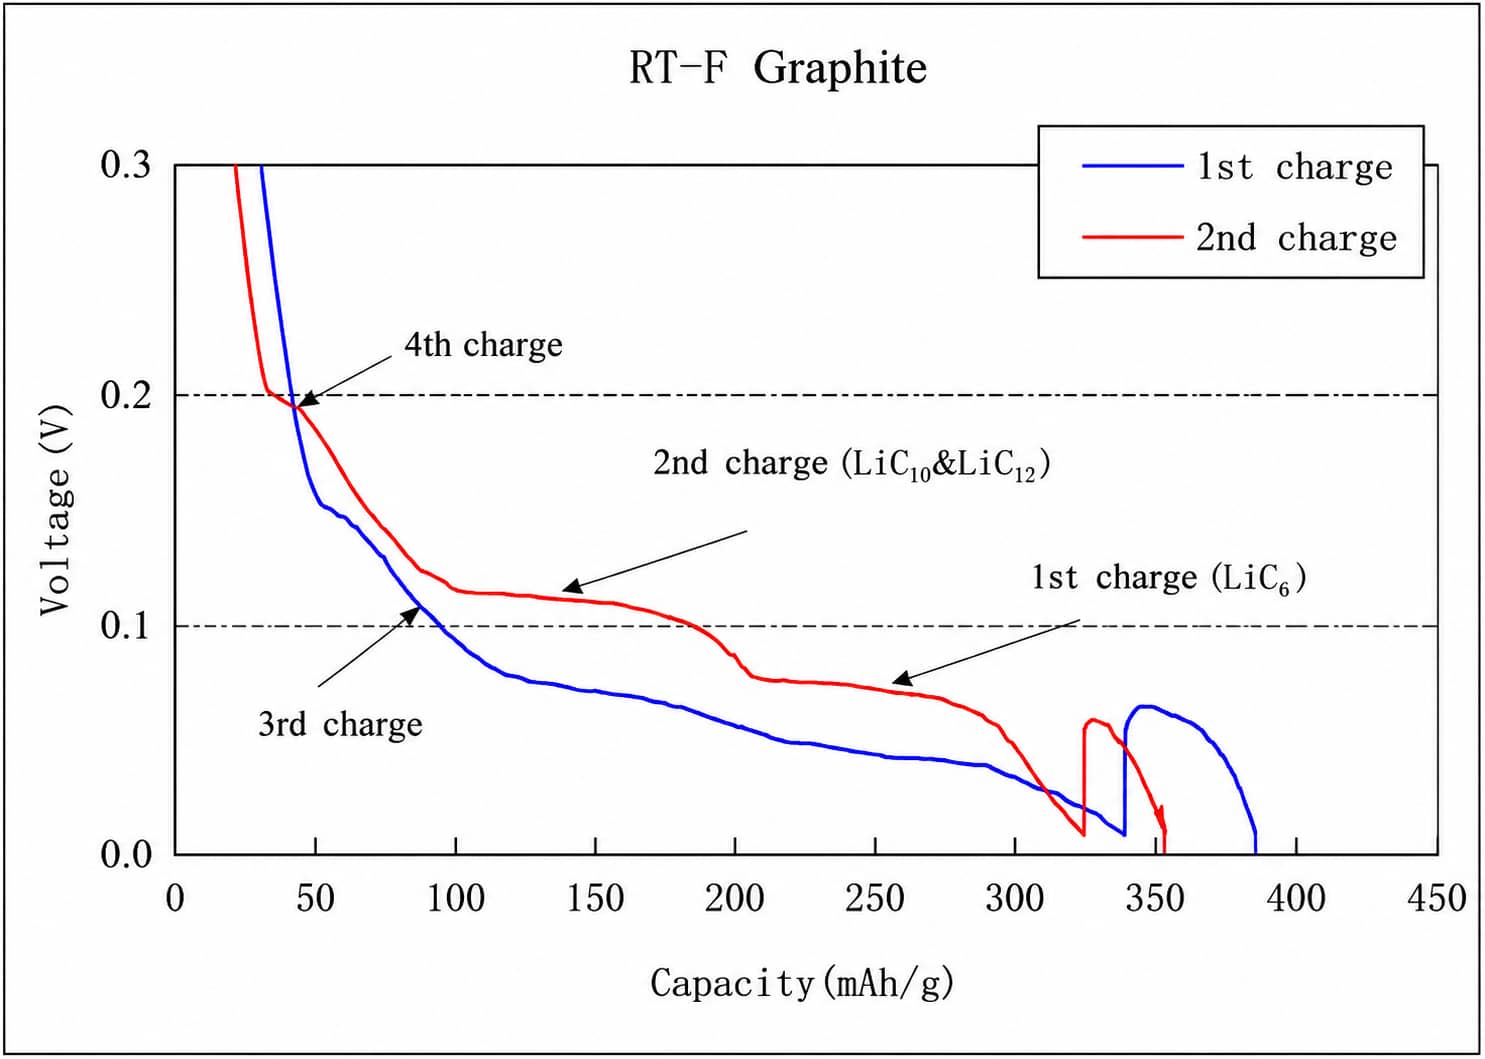
Graphite-Electrolyte Compatibility Risk: Solvent Co-Intercalation & Exfoliation
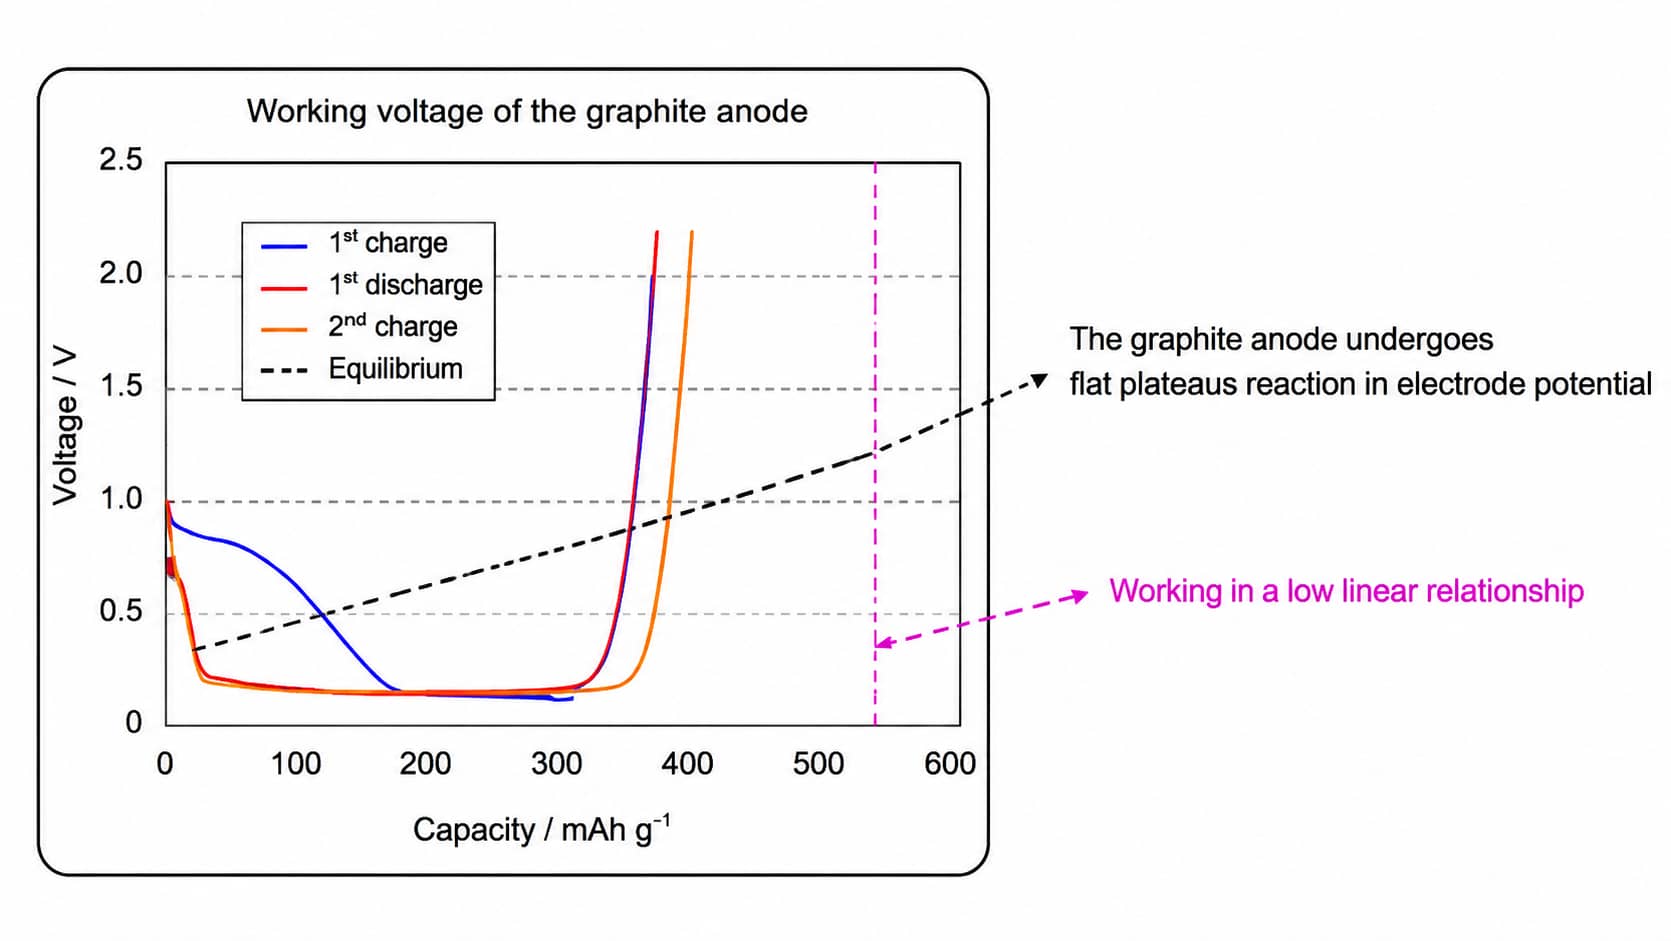
When paired with incompatible electrolyte solvent blends (high PC content without stabilizing additives), solvent co-intercalation triggers graphite layer exfoliation, creating massive first-cycle irreversible capacity loss. The electrolyte formulation directly dictates SEI integrity and long-term cycle stability.
3.2 Soft Carbon & Hard Carbon Amorphous Carbons
Core Definition & Raw Material Sources
- Soft Carbon (Easily Graphitizable Carbon)
Can be recrystallized into ordered graphite at >2500°C. Feedstocks include petroleum coke, needle coke, carbon microspheres, carbon fiber.Traits: d002 interplanar spacing = 0.34–0.35 nm, crystallinity Lc = 2–20 nm; good electrolyte compatibility, high first-cycle irreversible capacity, no distinct charge/discharge voltage plateau.
- Hard Carbon (Non-Graphitizable Carbon)
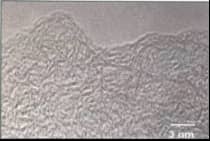
Polymer pyrolysis carbon that remains disordered even after extreme high-temperature calcination. Feedstocks: phenolic resin, epoxy resin, polyfurfuryl alcohol (PFA-C).Traits: d002 = 0.37–0.38 nm, crystallinity Lc = 1.1–1.2 nm; widely researched for sodium-ion battery anode applications.
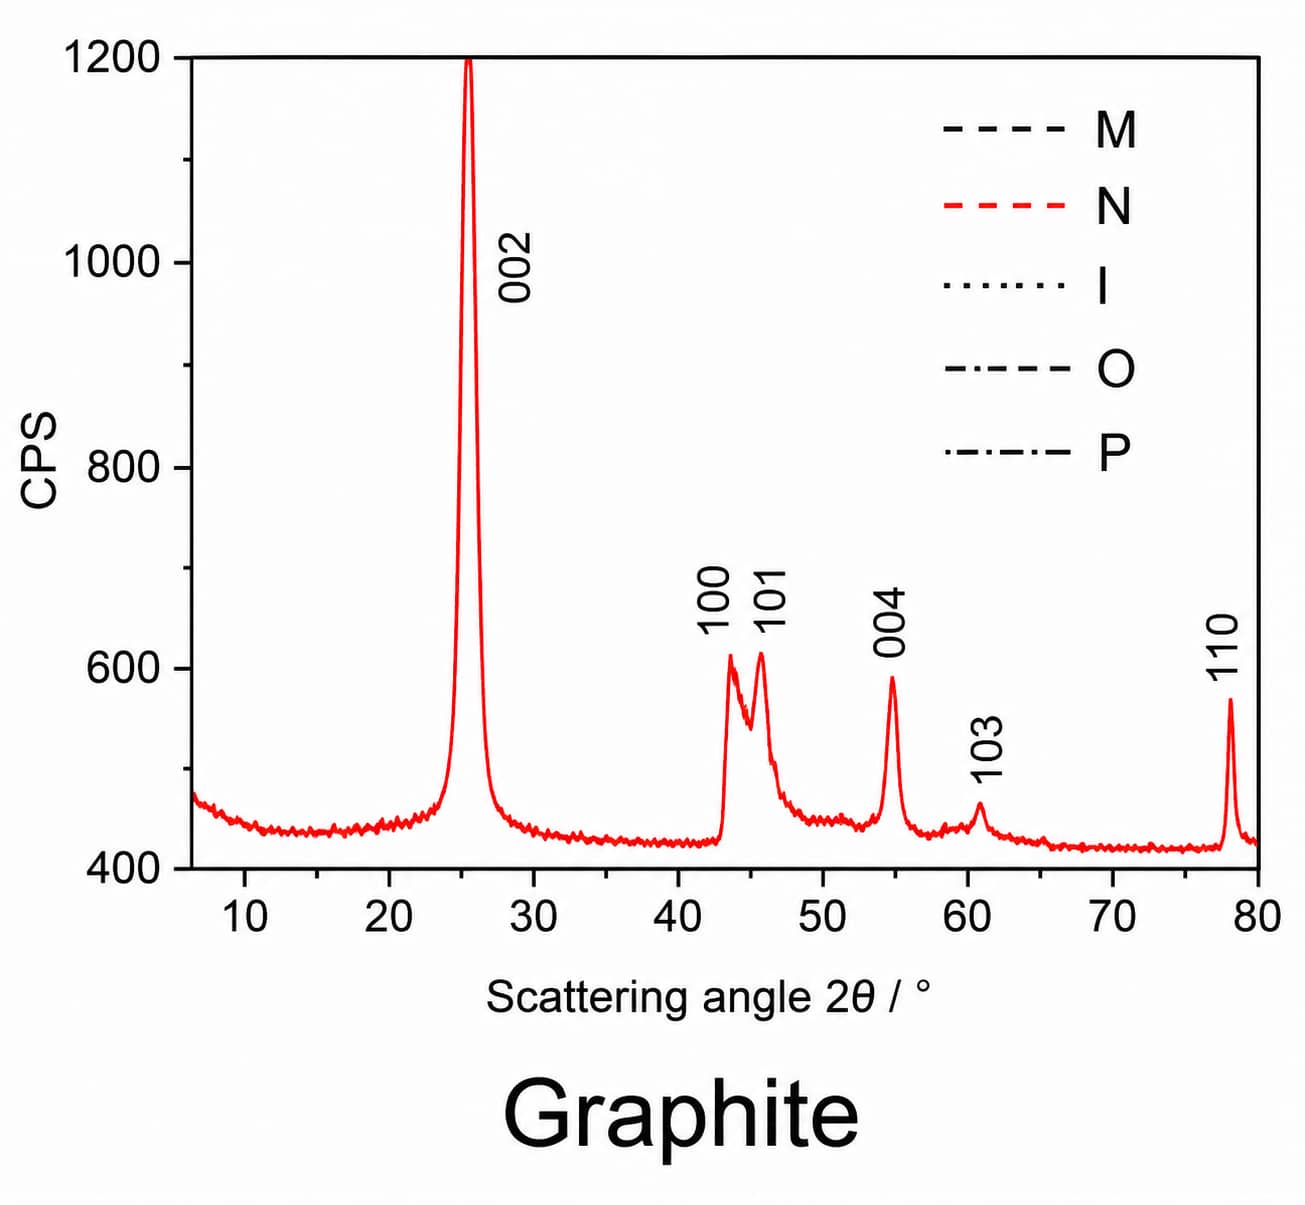
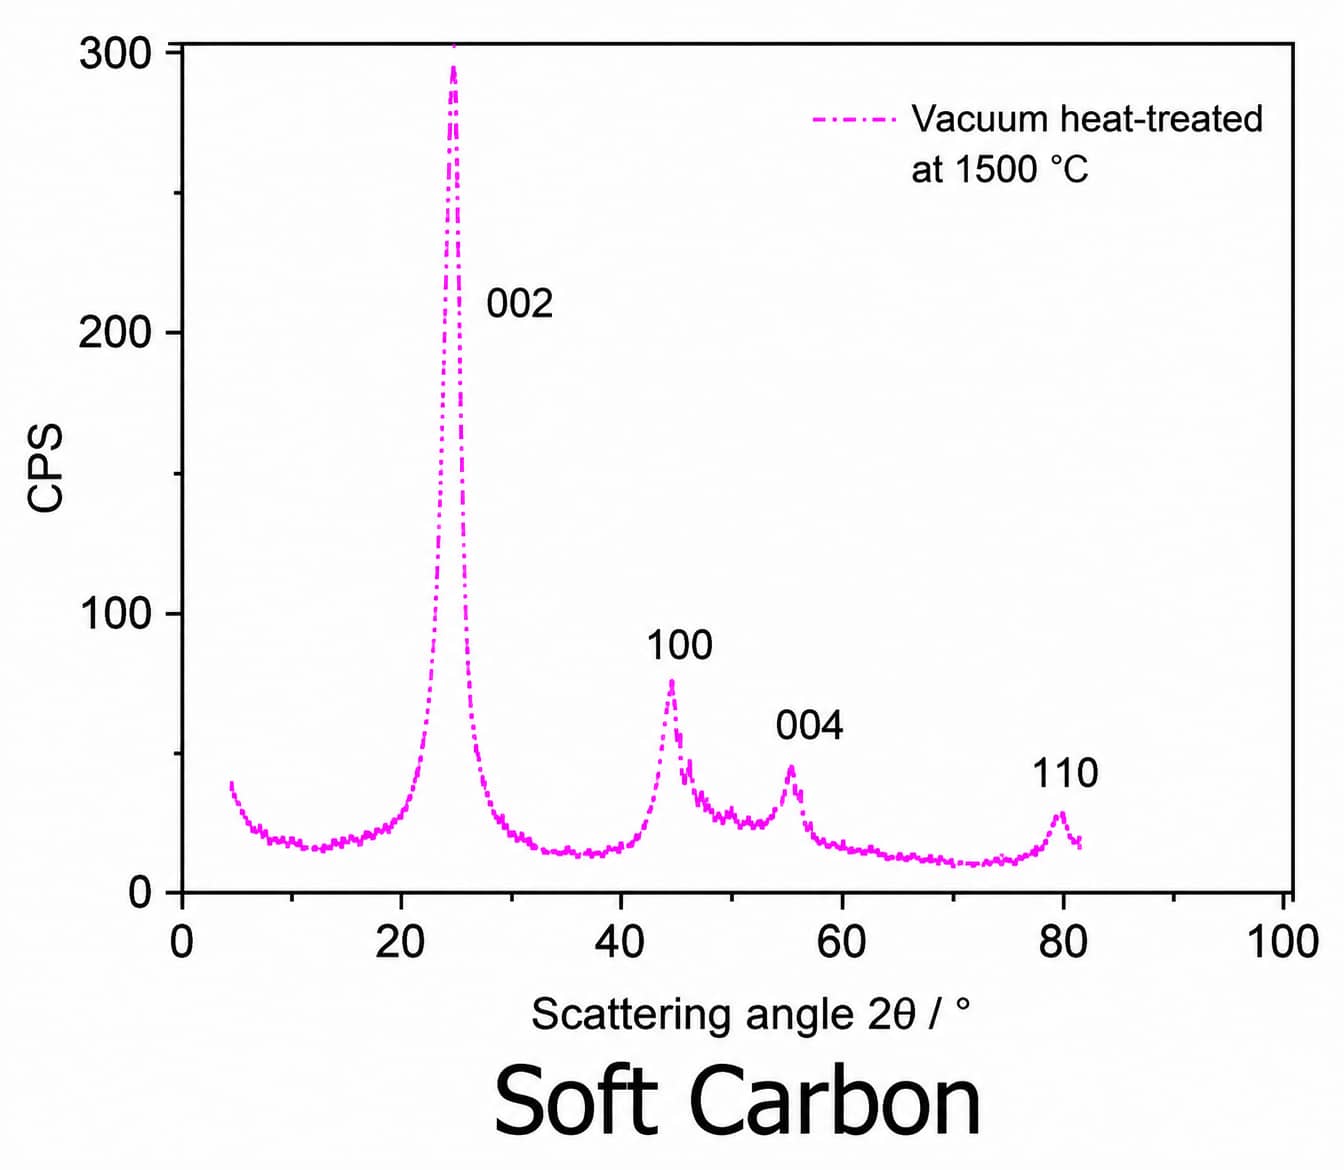
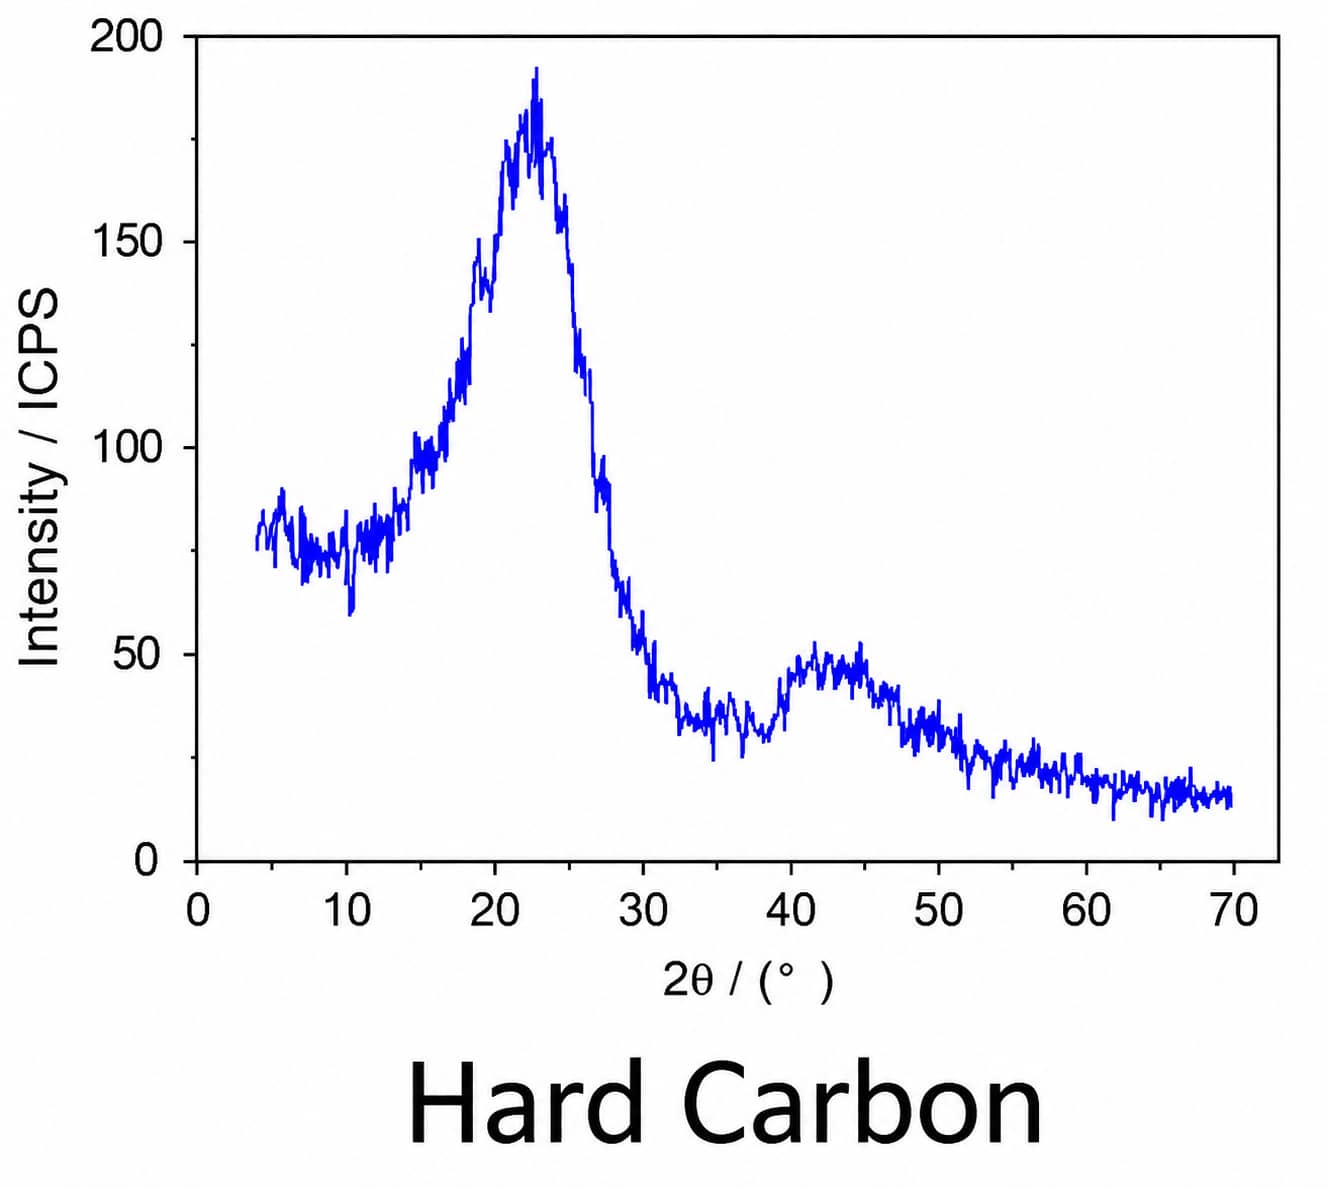
XRD comparison clearly demonstrates crystallinity differences: graphite exhibits sharp, narrow diffraction peaks, soft carbon has broadened moderate peaks, and hard carbon shows weak, diffuse signals.
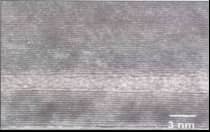
Structural Parameter Benchmark Table
| Test Parameter | Hard Carbon | Soft Carbon | Graphite |
|---|---|---|---|
| d(002) Interplanar Spacing (nm) | 0.37-0.38 | 0.34-0.35 | 0.335-0.34 |
| Crystallinity Lc (nm) | 1.1-1.2 | 2-20 | >80 |
| Bulk Material Density (g/cm³) | 1.50-1.60 | 1.80-2.10 | 2.20-2.26 |
| Electrode Compaction Density (g/cm³) | 0.9-1.0 | 1.1-1.3 | 1.5-1.8 |
3.3 Lithium Titanate (Li₄Ti₅O₁ / LTO Zero-Strain Anode)
LTO Core Advantages
- Near-zero lattice expansion during lithiation, delivering ultra-stable long cycle retention
- Flat discharge voltage platform at 1.56 V vs Li/Li⁺; this elevated potential suppresses most reductive electrolyte breakdown and reduces demand for thick conventional graphite-style SEI films
- Abundant, low-toxicity mineral raw material supply chain
Key Limitations
- Intrinsic electronic conductivity extremely low (~10⁻¹³ S/cm); carbon coating modification is mandatory for practical use
- Low theoretical capacity (172 mAh/g, practical cell output 150–160 mAh/g), limiting energy density for EV applications
- Higher raw material cost vs artificial graphite
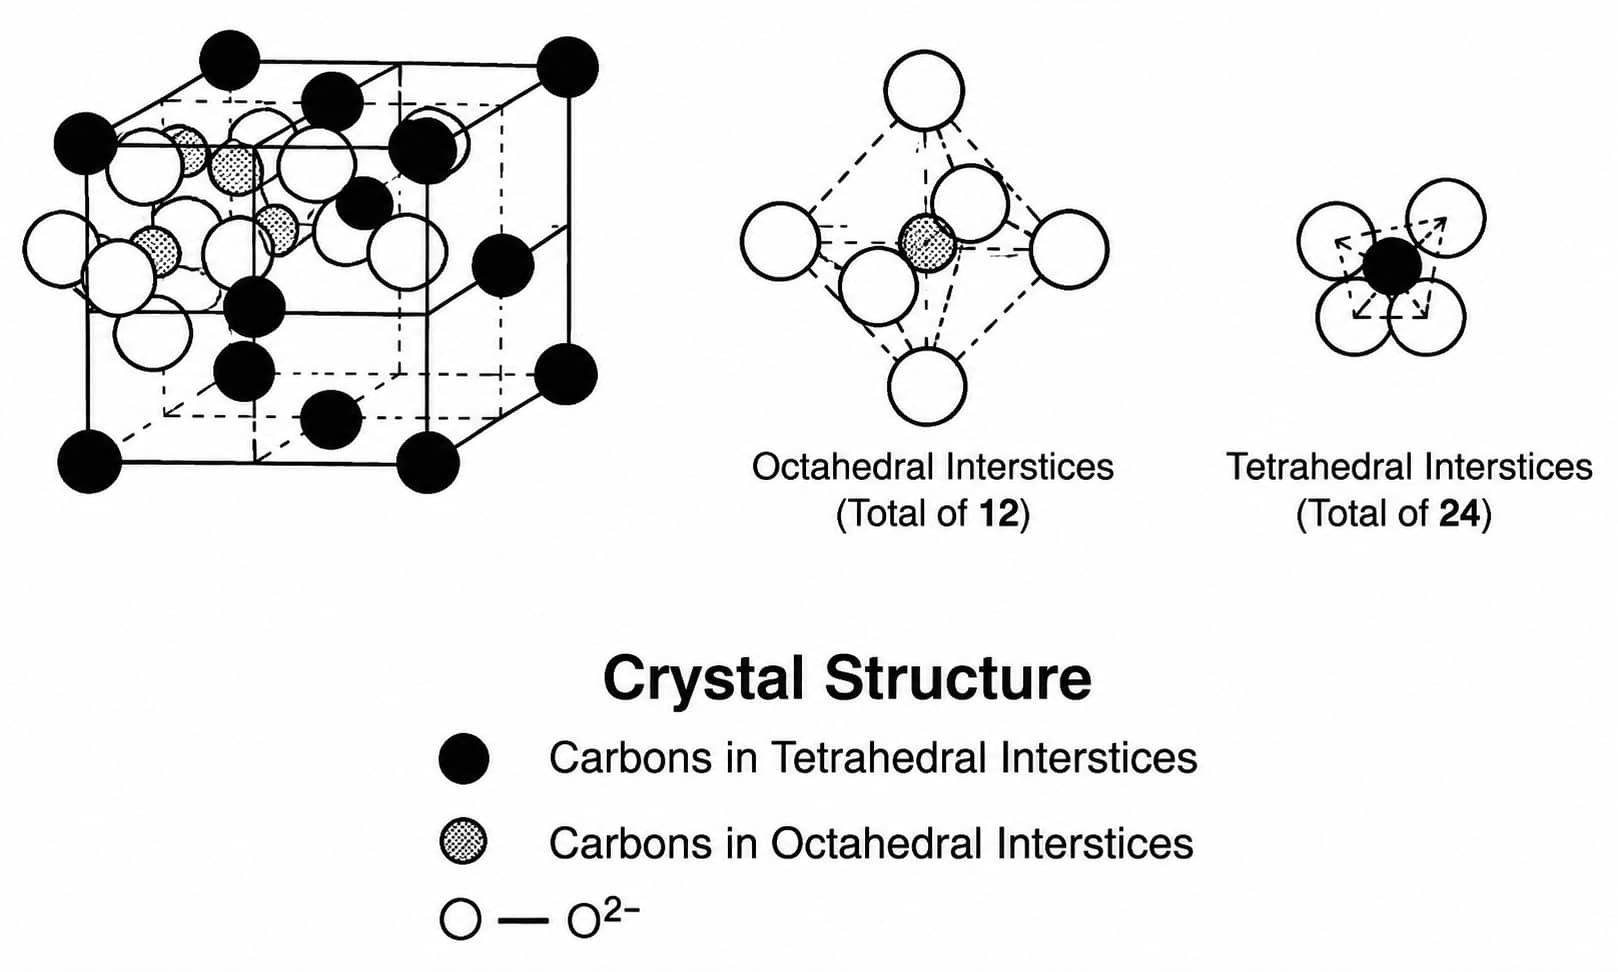
Diagram labels tetrahedral interstitial cation sites, octahedral interstitial cation sites and O²⁻ oxygen lattice framework.
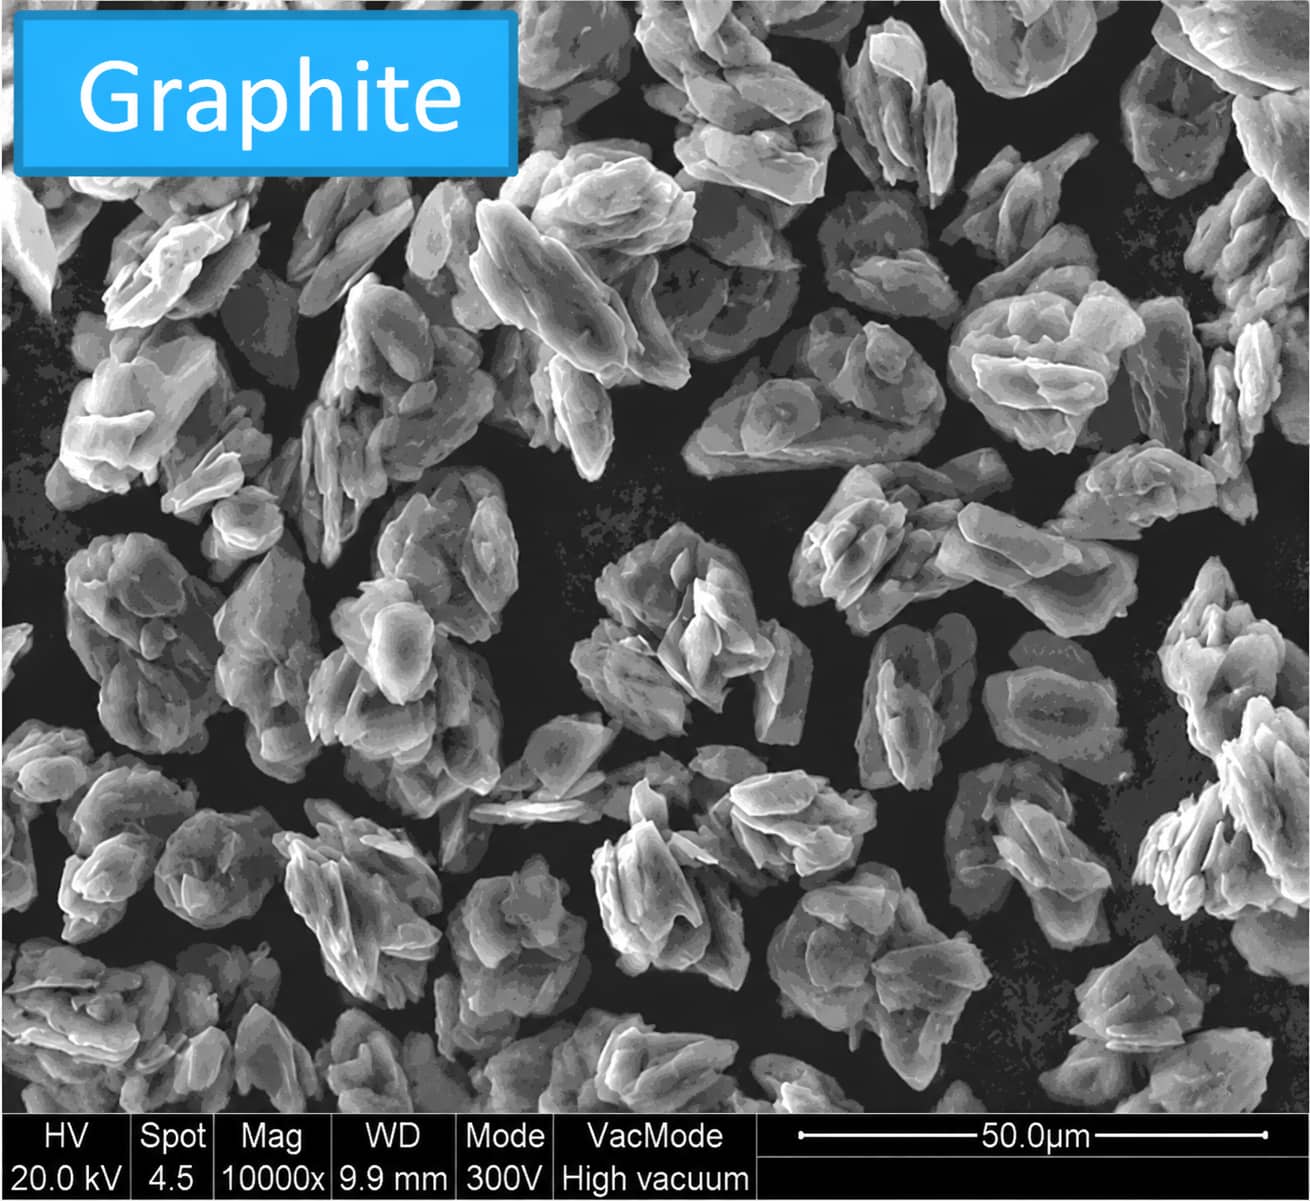
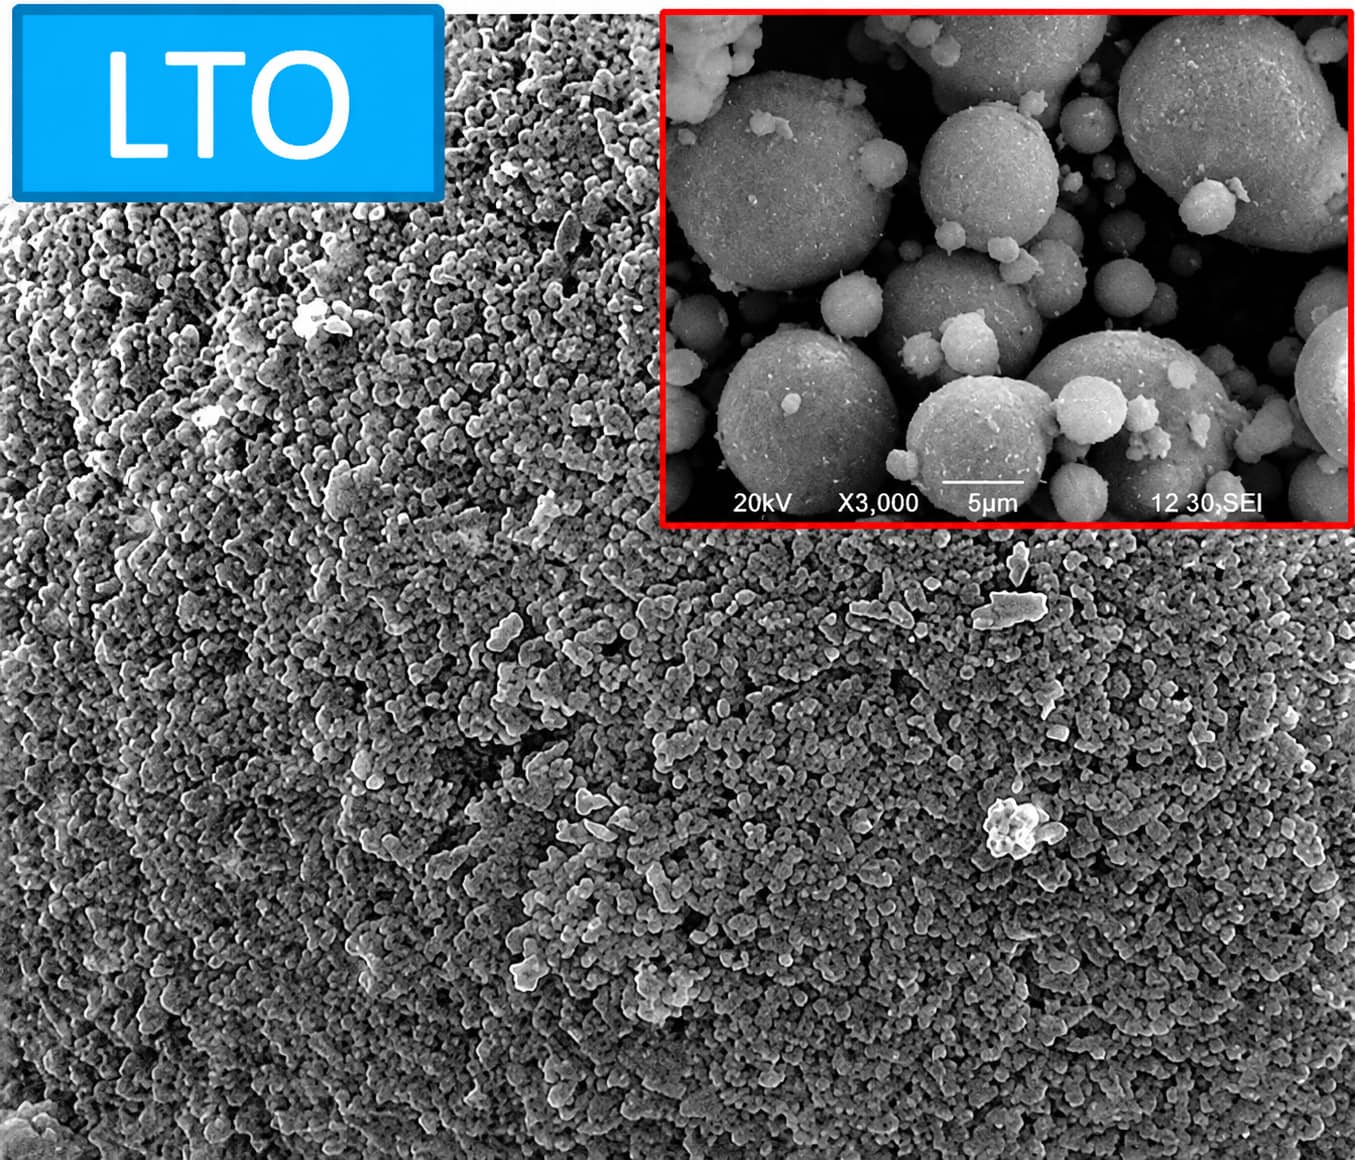
SEM morphology contrast: LTO forms uniform spherical microspheres; graphite shows irregular flaky primary particles.
LTO vs Graphite Electrochemical Benchmark
| Material | Theoretical Capacity (mAh/g) | Practical Cell Capacity (mAh/g) | Initial Coulombic Efficiency |
|---|---|---|---|
| Li₄Ti₅O₁₂ (LTO) | 172 | 150-160 | 96-100% |
| Artificial Graphite | 372 | 340-360 | 89-92 |
3.4 Silicon & Silicon-Carbon Alloy Anodes (High Energy Density Route)
Silicon Capacity & Volume Expansion Fundamentals
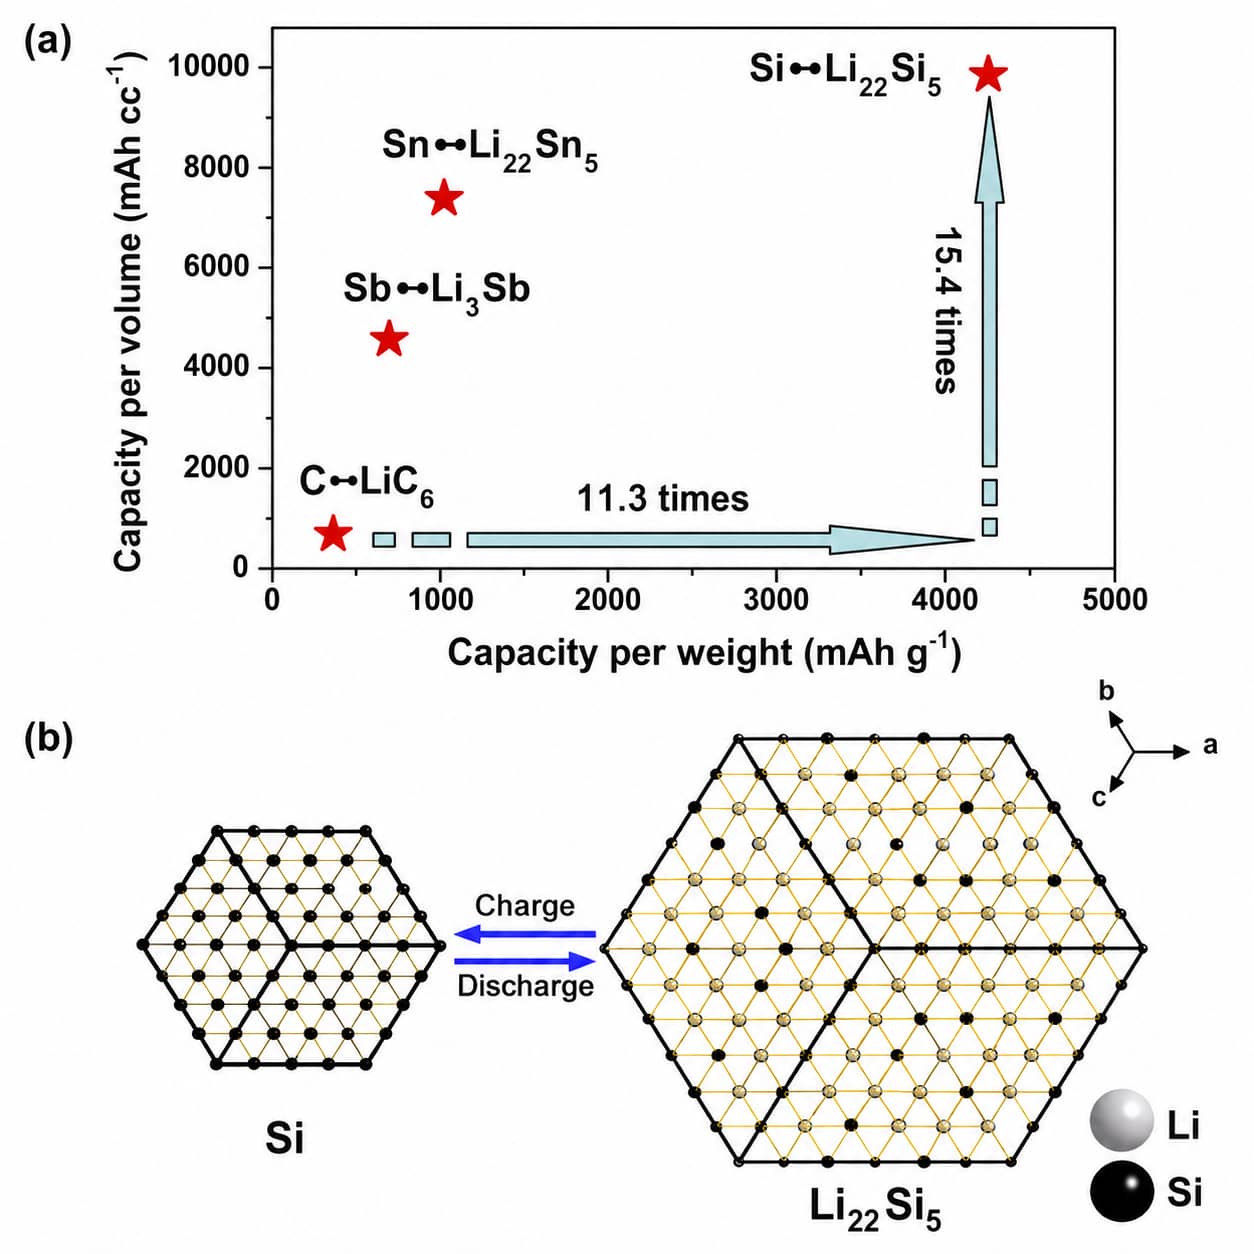
Critical Clarification: 300% volume expansion describes elemental silicon at maximum lithiation; actual electrode swelling depends on silicon loading, composite carbon matrix, porosity and binder formulation.
| Lithiated‑Silicon Phase | Volume / | Theoretical Capacity / |
|---|---|---|
| Si | 19.6 | 0 |
| LiSi | 31.4 | 954 |
| 43.5 | 1635 | |
| 51.5 | 1900 | |
| 67.3 | 3100 | |
| 76.4 | 3590 | |
| 82.4 | 4200 |
Note:1A=0.1nm
Chart compares gravimetric/volumetric capacity of C, Sn, Sb, Si; schematic displays silicon crystal lattice expansion after full lithiation into Li₂₂Si₅.
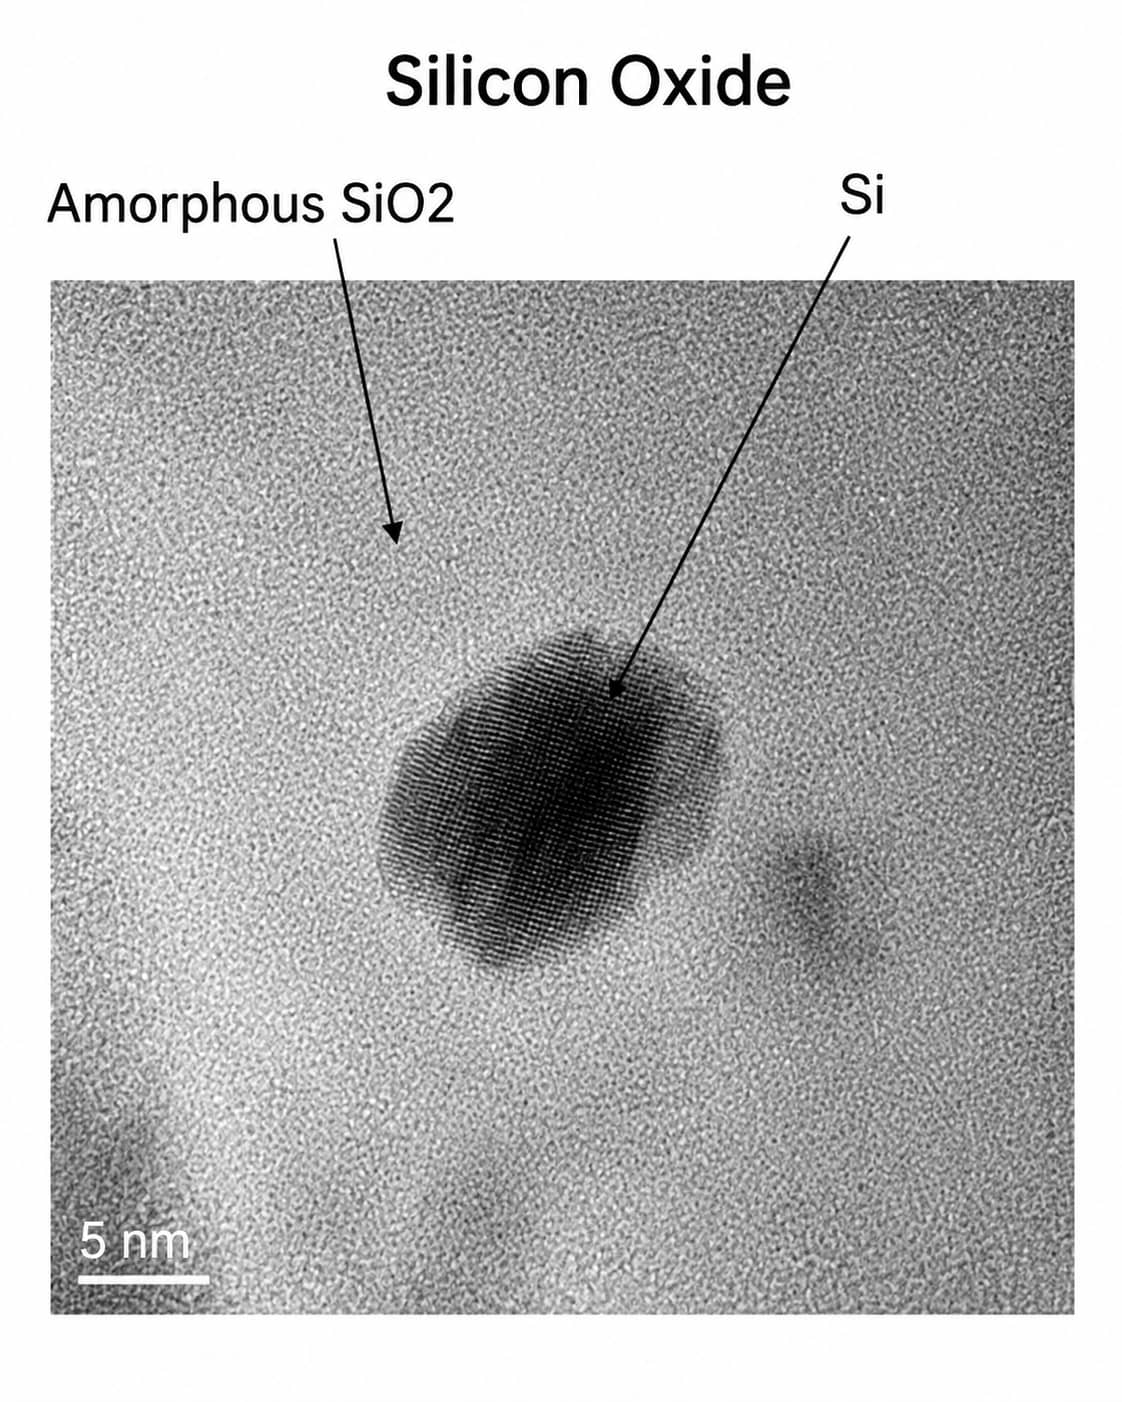
Three Commercial Silicon Anode Archit
| Silicon Anode Grade | Practical Capacity Range | Typical Initial ICE | Particle Size | 2026 Commercial Maturity | Core Pros & Cons |
|---|---|---|---|---|---|
| Silicon Oxide (SiOₓ) | ~1600 mAh/g | ~75% | <10 nm | High penetration in consumer electronics | Pros: Moderate particle expansion, stable cycling performance |
| Silicon Alloy Composite | ~1200 mAh/g | ~86% | <10 nm | Limited pilot-scale production | Pros: Higher initial coulombic efficiency, dense powder |
| Silicon-Carbon Composite | 400-1200 mAh/g | ~85% (1200 mAh/g grade) | <100 nm | Mass-mixed graphite for premium EVs | Pros: Balanced cost, capacity and structural buffer |
4. Industrial Graphite Modification Technologies
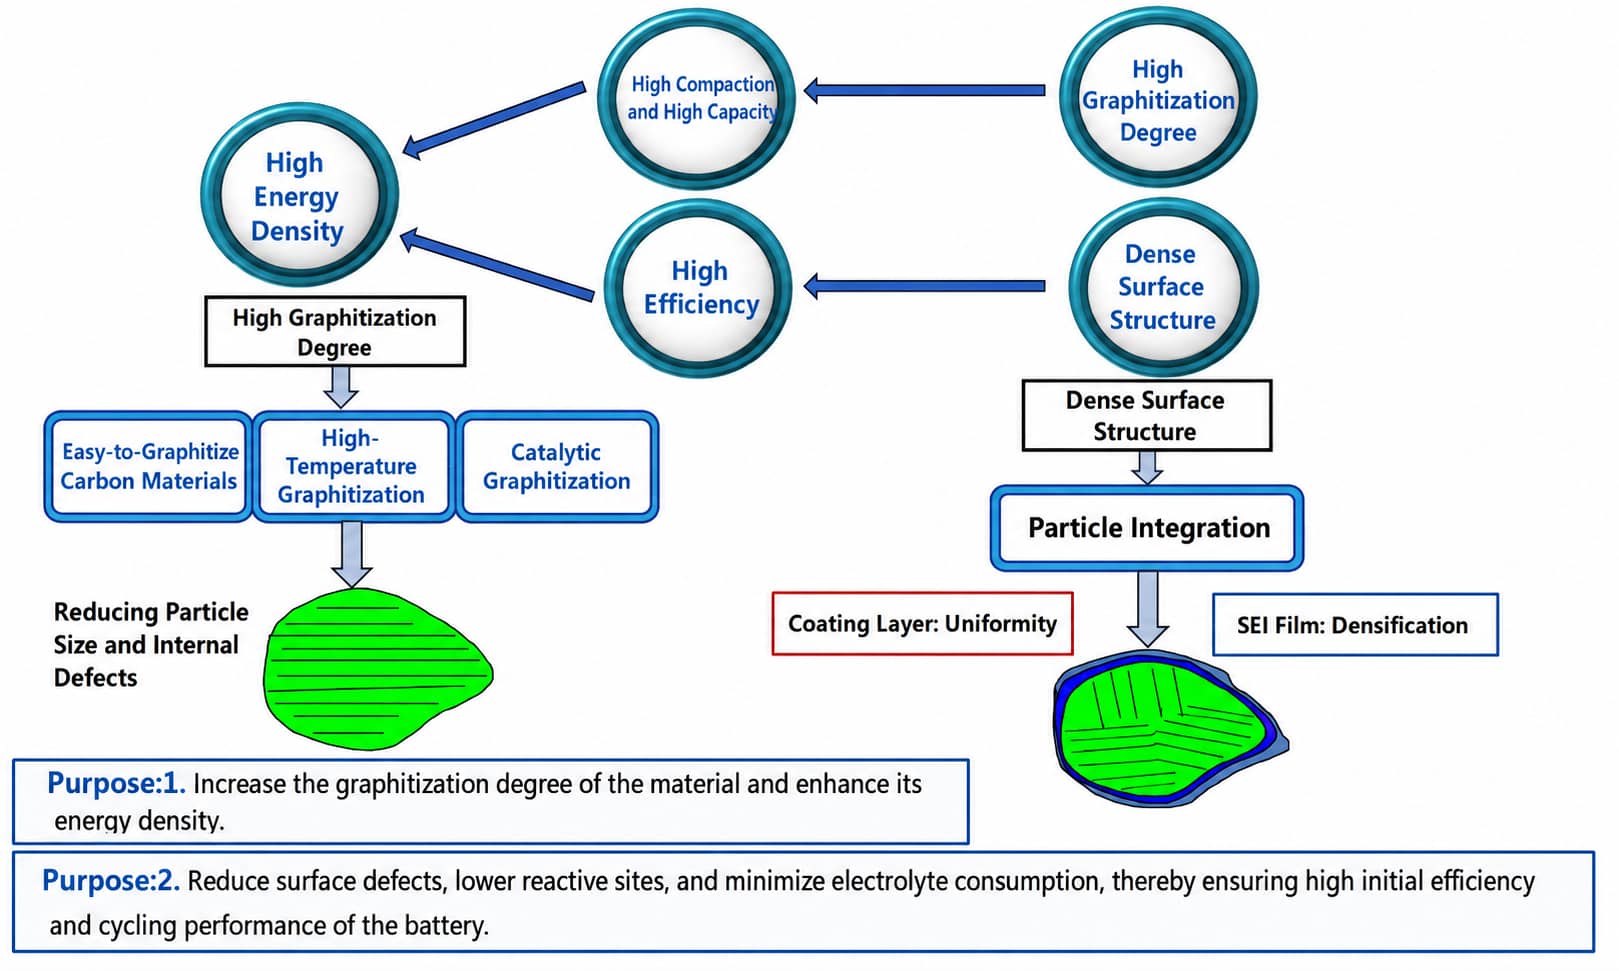
4.1 High Compaction Modification for Higher Volumetric Energy
Modification Mechanism
- Elevate graphite graphitization degree via high-temperature calcination or catalytic graphitization
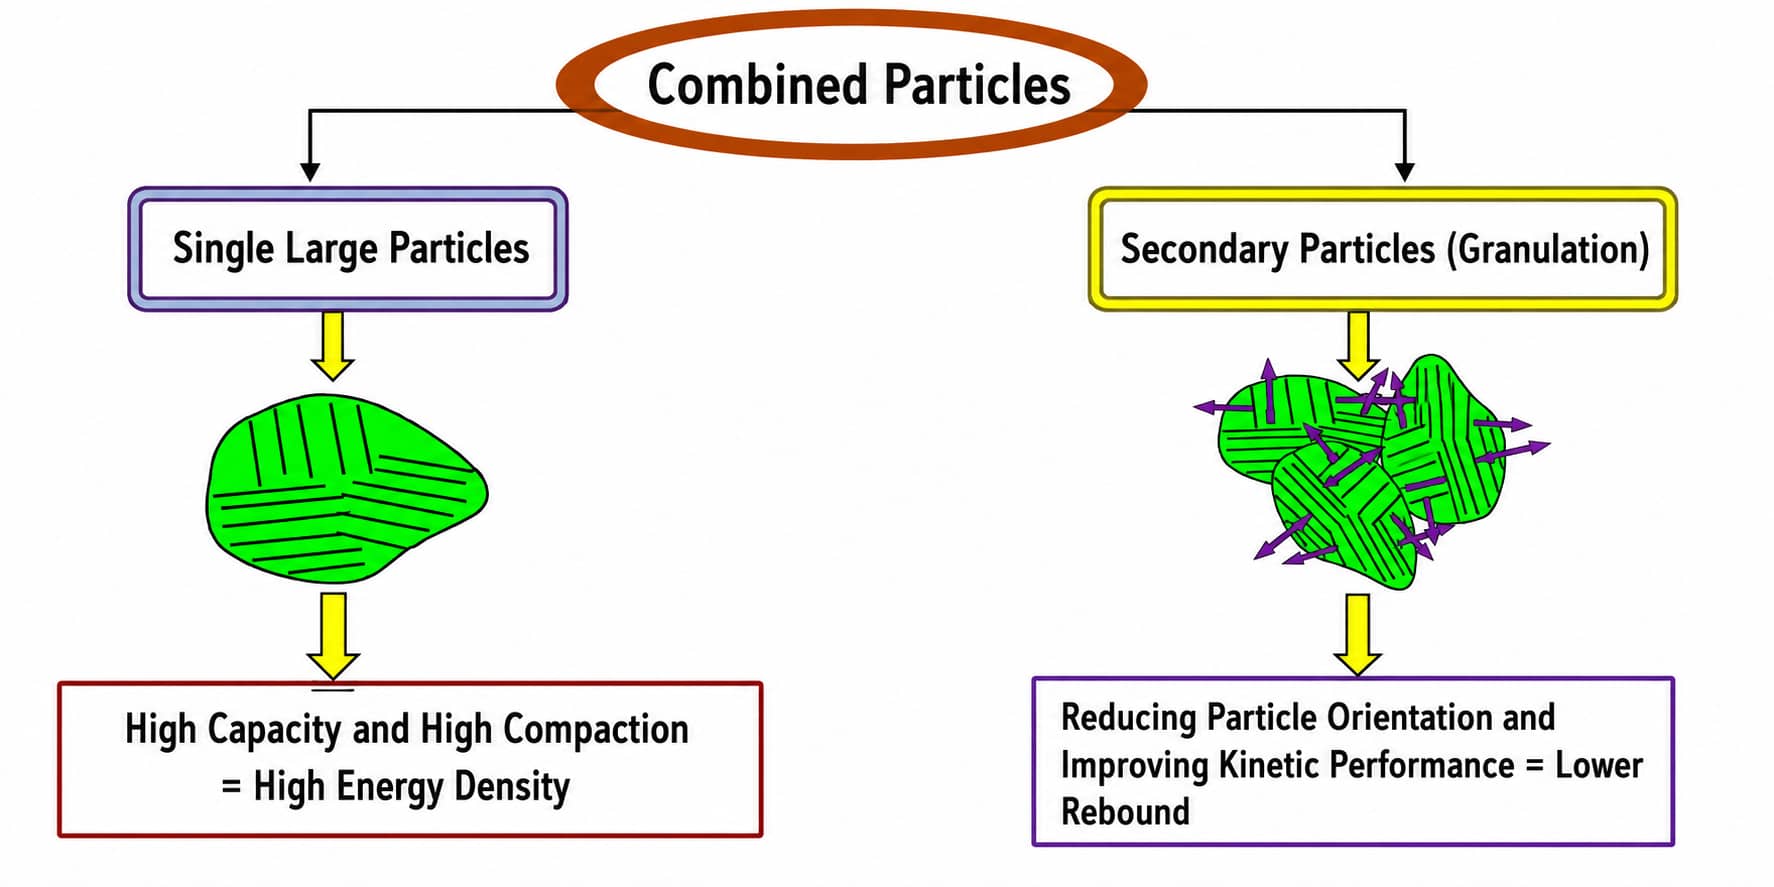
- Particle integration granulation to eliminate internal microcavities and structural defects
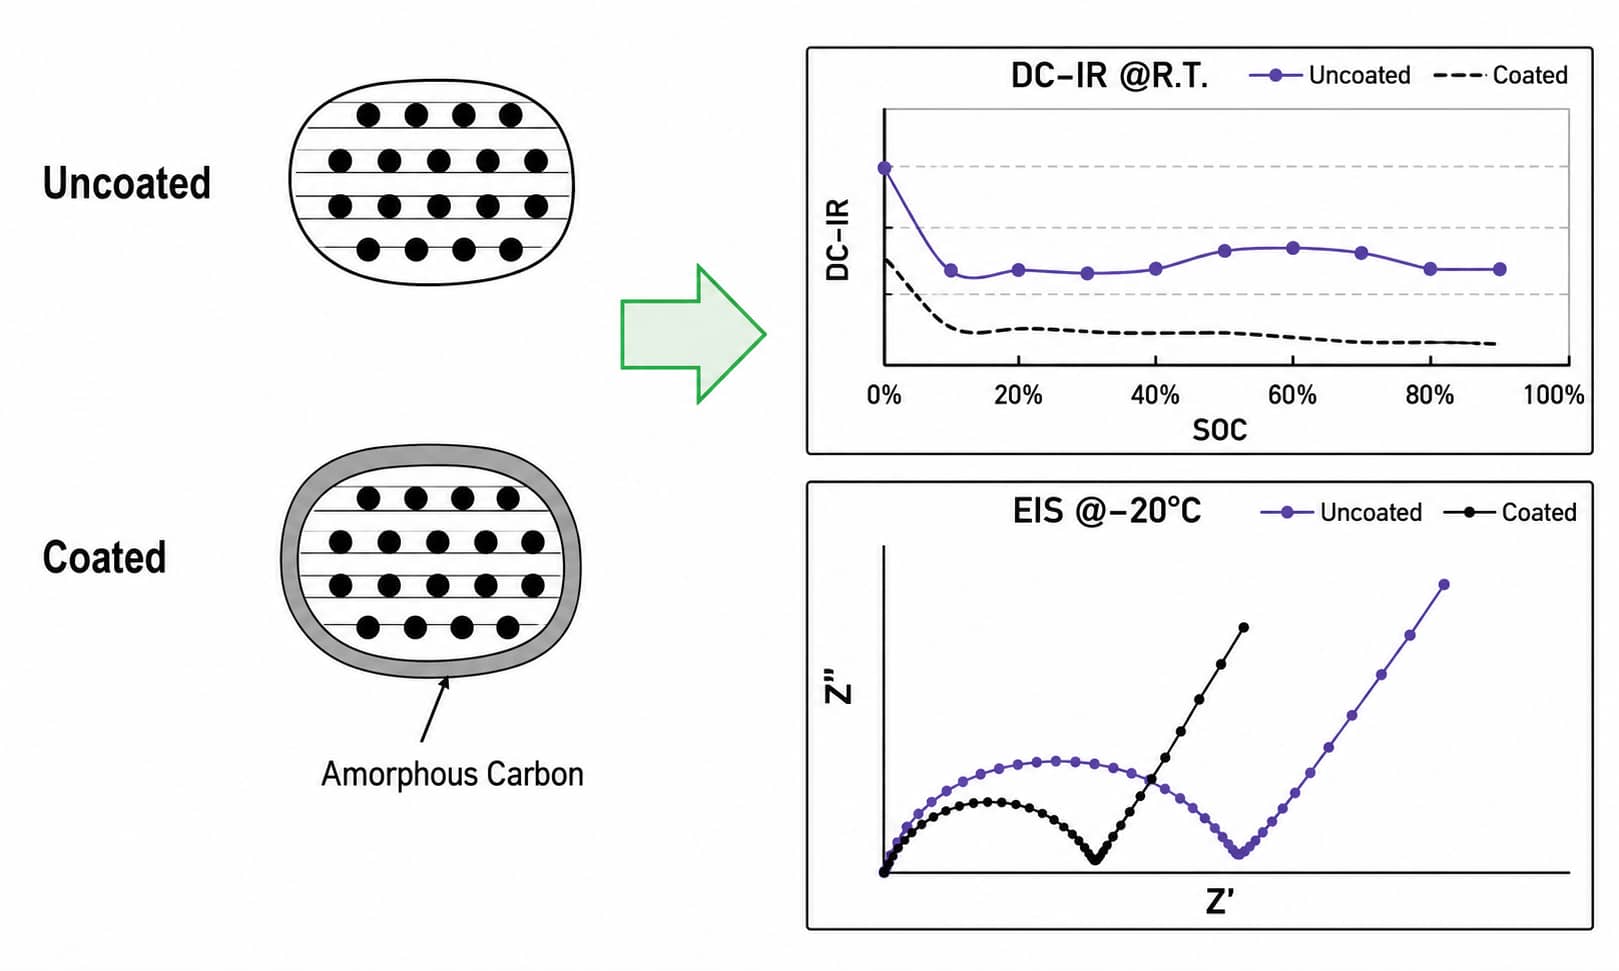
- Uniform dense amorphous carbon surface coating to reduce reactive edge plane sites and SEI side reactions
Core Functional Outcomes
- Optimizes particle tap density to support higher electrode compaction
- Cuts electrolyte parasitic consumption, lifting initial coulombic efficiency
- Improves volumetric energy output of finished electrodes
4.2 Low Rebound Granulation Modification for Long Cycle Life
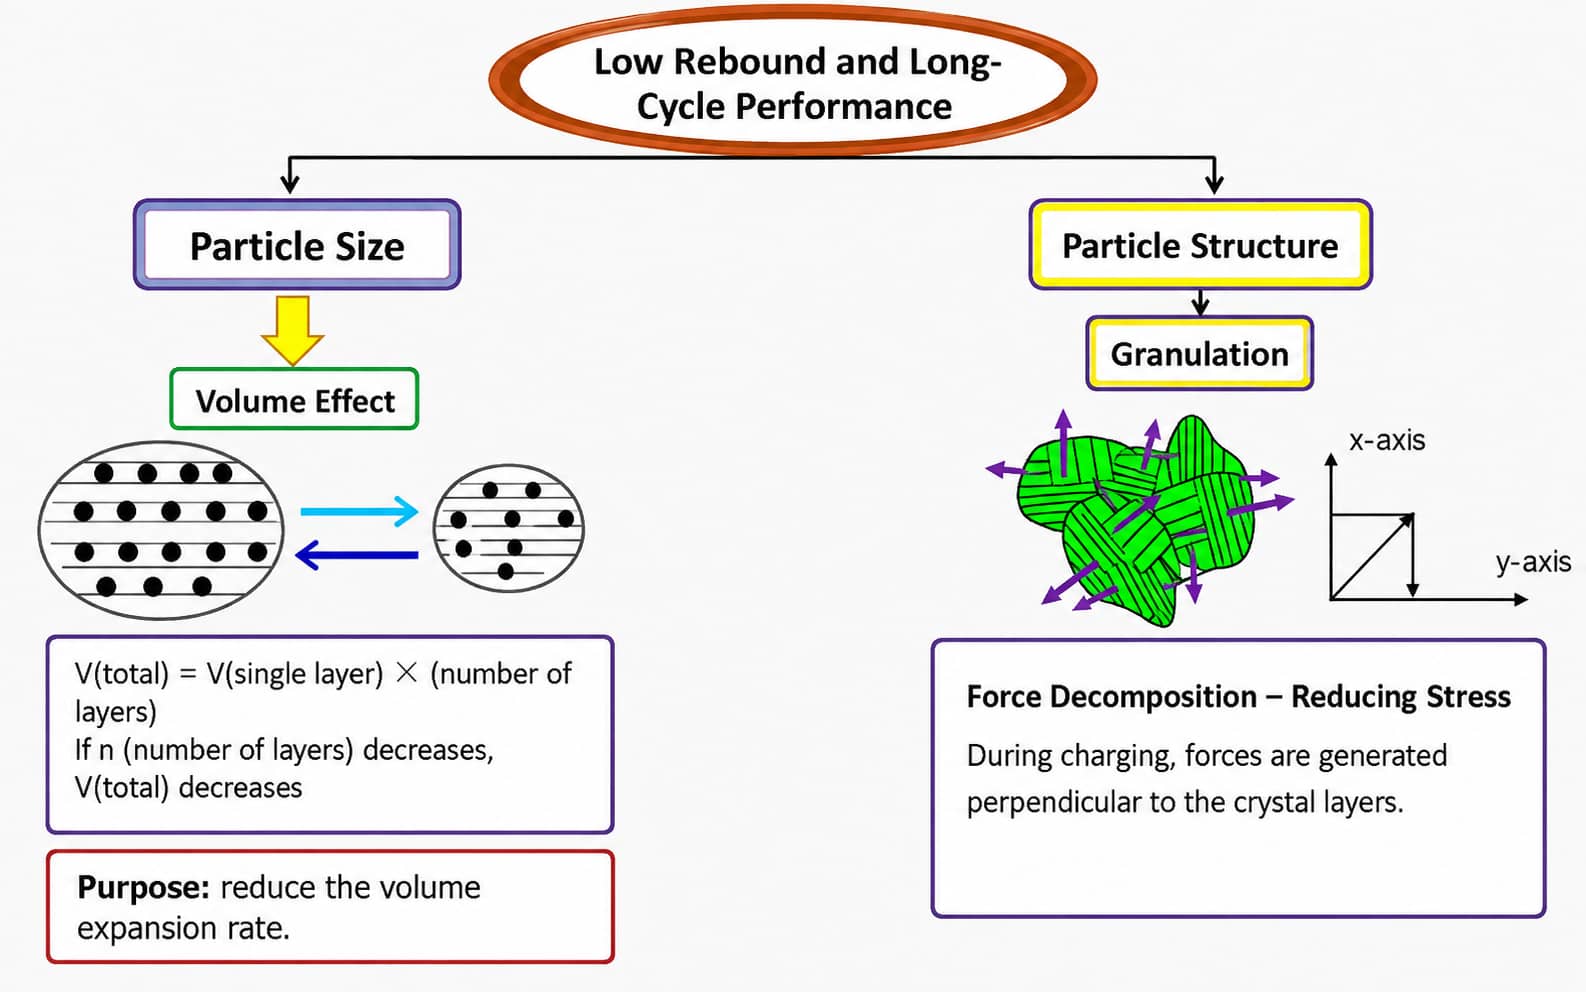
Modification Principle
Two Industrial Implementation Routes
- Primary particle optimization: Control grain size to reduce internal stacked carbon layer quantity and decompose lithiation stress
- Secondary granulation: Disordered particle stacking offsets directional volume expansion forces
4.3 Balanced Dual-Performance Secondary Particle Design
Design Solution
- Disordered particle orientation reduces electrode rebound after calendering
- Granulated spherical morphology retains high tap density for elevated energy density
4.4 Fast-Charging Modification: Amorphous Carbon Coating Fine Particle Tuning
Route 1: Amorphous Carbon Surface Coating
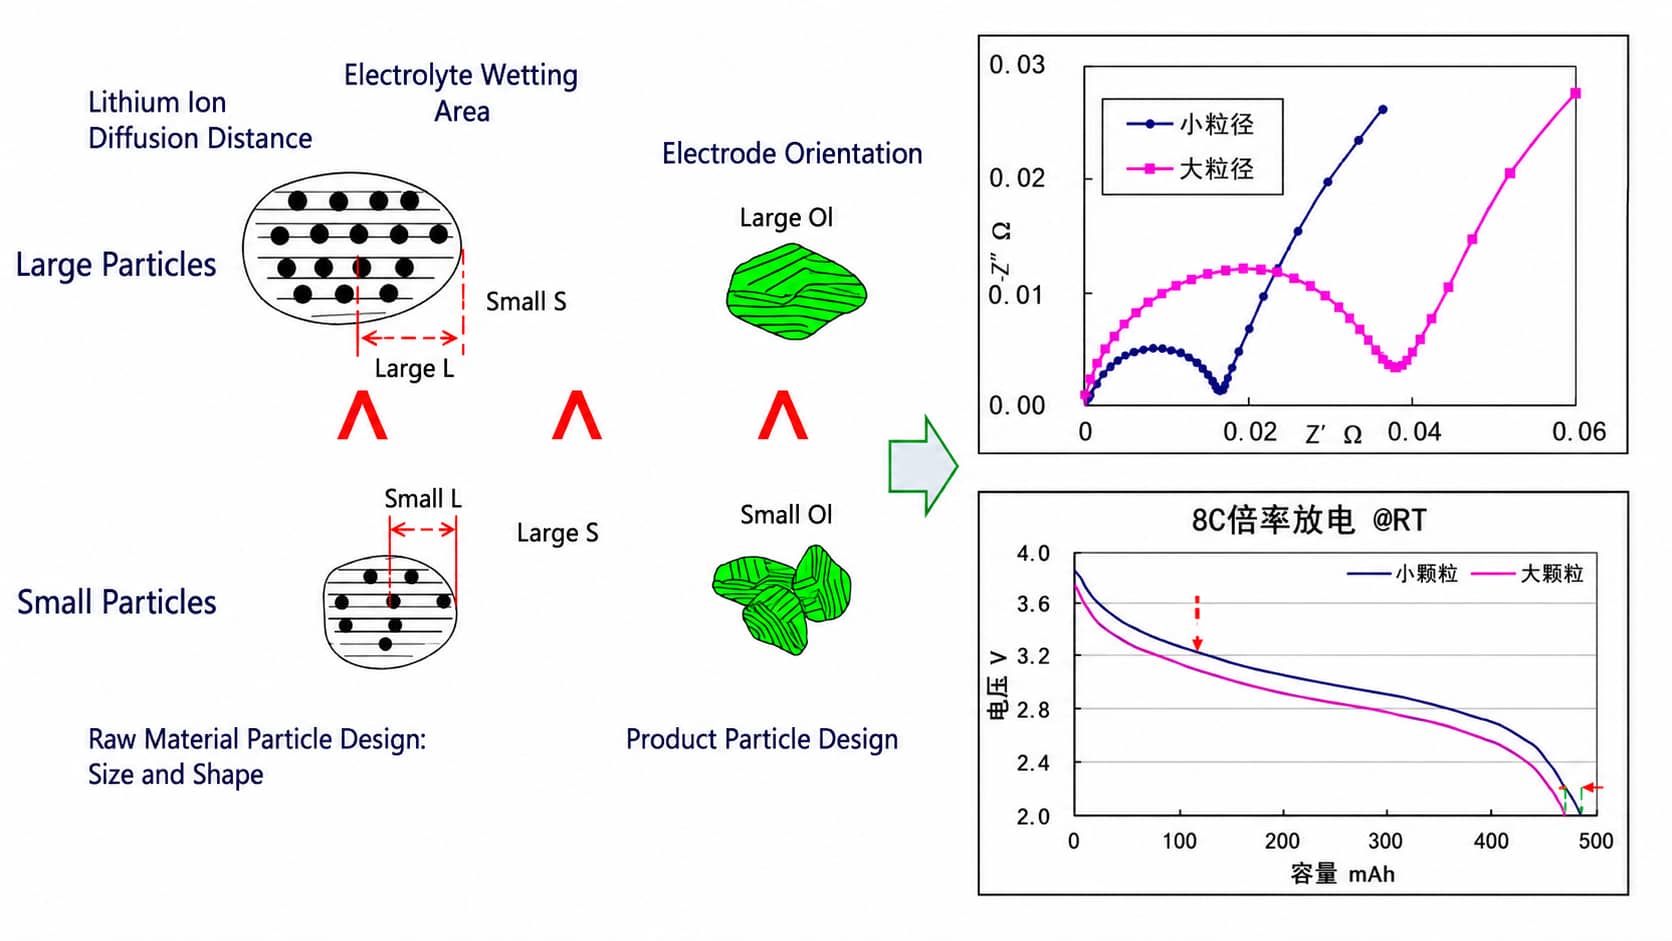
Route 2: Fine Primary Particle Optimization
5. Core Limitations of Non-Graphite Anode Systems
- Silicon / Silicon-Carbon Composites
Primary barriers: Large particle-level volume expansion, continuous SEI rupture during cycling, low initial lithium efficiency. Industry mitigation strategies: nano-sizing silicon grains, carbon matrix encapsulation, flexible CMC/PAA water-based binders.Internal Link: Silicon Anode Expansion Mitigation Technology
- LTO Lithium Titanate
Primary barriers: Low intrinsic electronic conductivity, low practical specific capacity, higher raw material pricing. Mitigation: Nano-carbon coating blending with artificial graphite for hybrid anode sheets.
- Hard Carbon
Primary barriers: Low electrode compaction density, high first-cycle irreversible capacity, indistinct discharge voltage plateau. Main use case: sodium-ion energy storage cells.
6. Complete Anode Validation Workflow: Powder → Slurry → Electrode → Half Cell → Full Cell
| Test Stage | Core Characterization Items | Decision Standard Purpose |
|---|---|---|
| Raw Powder | D50/D90 particle size, BET specific surface, tap density, d002 XRD spacing, TEM morphology, moisture content | Screen baseline material quality, pre-judge SEI side reaction risk |
| Anode Slurry | Viscosity, solid content, fineness grind gauge, suspension stability, rheology, sedimentation test | Prevent coating defects: pinholes, uneven thickness, agglomeration spots |
| Coated Electrode | Target areal loading, calendering compaction, thickness rebound test, peel strength, sheet resistance, surface defect inspection | Validate particle orientation, binder adhesion, electrode mechanical stability |
| Lithium Half Cell | First-cycle ICE, reversible capacity, dQ/dV voltage plateaus, 0.2C/1C/3C rate discharge, 50–100 cycle retention, EIS impedance | Fast preliminary material screening under ideal unlimited lithium source |
| Full Cell (Graphite/Si-C Anode Commercial Cathode) | N/P capacity ratio matching, full-cell initial efficiency, room/low-temperature fast-charging, long-cycle capacity retention, cell swelling, gas generation test | Simulate real industrial battery conditions with finite cathode lithium inventory; identify hidden degradation pathways only visible in full cells |
| Prototype Pouch/Cylindrical Cell | Calendar aging test, high-rate continuous charging, thermal stability, expansion measurement, batch consistency verification | Final mass-production qualification before large-scale material procurement |
7. Common Anode Defect Diagnosis & Evidence-Based Troubleshooting
| Observed Production / Test Defect | Priority Diagnostic Evidence To Collect | Root Cause Categories | Next Step Validation Test |
|---|---|---|---|
| Low initial coulombic efficiency (graphite) | First-cycle dQ/dV curve, powder BET, post-mortem SEM, gas chromatography of formation gas | Excess edge plane SEI formation, solvent co-intercalation exfoliation, high surface moisture | Cross-test multiple electrolyte additive formulations; compare low-BET coated graphite grades |
| Severe electrode rebound post-calendering | Pre/post calendering thickness, particle SEM morphology, electrode OI orientation index | Highly oriented flake graphite grains, insufficient secondary granulation | Trial low-rebound granulated modified graphite; adjust calendering pressure window DOE |
| Poor fast-charging performance, voltage sag under high C-rate | DC-IR full SOC scan, low-temperature EIS, 8C discharge curves, lithium plating post-mortem | Long lithium diffusion distance, insufficient carbon conductive network, low electrolyte wetting | Compare fine-particle amorphous carbon coated graphite grades |
| Silicon composite cell swelling & capacity fade | Cycled pouch cell tickness tracking, post-mortem particle pollution SEM, ICE cycle decay | Uncontrolled silicon volume expansion, fractured SEI film, insufficient carbon buffer matrix | Adjust silicon mass loading ratio; test high-flexibility PAA binders |
| Hard carbon low reversible capacity | XRD d002 spacing, pore size distribution, first-cycle irreversible capacity | Disordered open pore structure trapping lithium ions | Pre-heat hard carbon powder to remove surface functional groups; match low-solvation electrolyte |
| Elevated electrode internal resistance | Electrode sheet resistance, EIS charge transfer resistance, slurry dispersion fineness | Poor powder dispersion, incomplete carbon coating, insufficient conductive carbon additive | Optimize slurry mixing shear time and vacuum degassing steps |
8. FAQ
Q1: Can silicon anode fully replace graphite in mass EV batteries in 2026?
Q2: What graphite modification delivers the best fast-charging performance?
Q3: What are the core disadvantages of LTO lithium titanate?
Q4: How to minimize graphite electrode rebound after calendering?
Q5: Why do graphite anodes produce large irreversible capacity in the first formation cycle?
Conclusion
Related Products & Services
Use Canrd products and R&D services to turn battery knowledge into practical experiments.
Coin Cell Case
ProductCoin cell cases for validating materials and electrochemical concepts from the article.
Use coin cell cases in your next test →Sodium Electrolyte
CategoryElectrolytes for sodium-ion battery research, compatibility tests, and cell validation.
Shop sodium electrolyte for validation →Cell Fabrication
ServiceGet support building dry cells, assembled cells, or custom formats for R&D validation.
Request cell fabrication support →Experimental Materials
CategoryBrowse materials for follow-up experiments, benchmarking, and product development.
Browse experimental battery materials →