

 contact@canrd.com

 +86 18928276992
GITT Battery Testing Guide: How to Calculate Diffusion Coefficients
Ion transport kinetics strongly influence the electrochemical performance of rechargeable batteries. For researchers developing lithium-ion cathodes, silicon-based anodes, sodium-ion electrodes or zinc-ion battery materials, understanding ion migration inside electrode materials is critical to evaluate rate capability and identify kinetic bottlenecks. The Galvanostatic Intermittent Titration Technique (GITT) is one of the most widely adopted electrochemical characterisation tools for this purpose.
GITT applies sequential controlled constant-current pulses followed by open-circuit relaxation. By analysing the voltage response, researchers can calculate the chemical diffusion coefficient of mobile ions within electrode materials under valid theoretical assumptions.
GITT is far more than applying a low current and plugging voltage readings into an equation. Pulse duration, relaxation time, electrode geometry, internal resistance and phase-transition behaviour significantly affect calculated results. This practical guide for battery R&D labs covers GITT fundamentals, test parameter selection, diffusion coefficient calculation, curve interpretation, common pitfalls and validation strategies.
1. What Is GITT in Battery Testing?
GITT (Galvanostatic Intermittent Titration Technique) is an electrochemical characterisation method combining short constant-current pulses and open-circuit relaxation to study electrode thermodynamics and ion transport kinetics. Originally developed to investigate transport properties of solid electrochemical materials, GITT is now widely used in rechargeable battery research.
Typical applications:
- Lithium-ion diffusion analysis in LFP, NMC/NCM, LCO and other cathode materials
- Lithium transport characterisation in graphite, silicon and silicon-carbon anodes
- Sodium-ion transport studies for sodium-ion battery electrodes
- Investigation of apparent Zn-ion kinetics in aqueous zinc battery electrodes
- Comparison of electrode kinetics at different states of charge (SOC)
- Evaluation of charge/discharge asymmetry and material-specific kinetic behaviour
The chemical diffusion coefficient describes concentration-driven transport in the electrode material within a specified transport model. It is distinct from microscopic tracer diffusivity and may depend on composition, thermodynamic factors and material properties. GITT-derived values should therefore be interpreted within the assumptions of the selected electrochemical model.
GITT vs Other Electrochemical Characterisation Methods
| Method | Full Name | Primary Application |
|---|---|---|
| GITT | Galvanostatic Intermittent Titration Technique | Estimate chemical diffusion coefficients and quasi-equilibrium voltage profiles |
| PITT | Potentiostatic Intermittent Titration Technique | Diffusion and reaction analysis via potential steps |
| CV | Cyclic Voltammetry | Redox behaviour, reaction reversibility and qualitative kinetic screening |
| EIS | Electrochemical Impedance Spectroscopy | Deconvolution and modelling of electrochemical impedance |
| CPR | Current Pulse Relaxation | Transient voltage and polarisation analysis |
| PSCA | Potential Step Chronoamperometry | Current transient response after potential steps |
| PRT | Potential Relaxation Technique | Kinetic investigation based on voltage relaxation |
While these techniques all provide ion-transport related information, their governing physical models and assumptions differ. GITT excels when researchers need to track how apparent diffusion evolves across the full charge or discharge voltage window.
2. Working Principle of GITT
A GITT test repeats two alternating stages: constant-current pulse and open-circuit relaxation, sweeping across the predefined SOC or voltage range.
2.1 Stage 1: Apply a Constant-Current Pulse
When a small constant charge or discharge current is applied, cell voltage changes. The immediate sharp voltage jump includes ohmic drop originating from electrolyte, electrodes, current collectors and contact resistance. Depending on instrument time resolution, fast interfacial polarisation also contributes to the transient signal. With prolonged current flow, electrochemical reactions and ion transport build extra concentration and interfacial polarisation. For diffusion-controlled systems under valid conditions, Fick’s second law links this voltage transient to ion diffusion.
2.2 Stage 2: Cut Off the Applied Current
After each pulse, current is set to zero. Voltage exhibits a rapid change as ohmic contribution disappears, followed by slow relaxation. During open-circuit rest, concentration gradients within active particles gradually decay. Additional effects including interfacial relaxation and mass redistribution inside porous electrodes also shape the measured signal. Voltage slowly converges toward a Like a powerful equilibrium.. Insufficient relaxation time will distort ΔEₛ and bias the fitted diffusion coefficient.
2.3 Repeat Pulse–Relaxation Cycles
The sequence continues until reaching the target voltage or SOC limit. Typical workflow: Rest → Constant-current pulse → Open-circuit relaxation → Repeat → Stop at voltage cutoff.
The same logic applies to both charge and discharge. However, voltage profiles and extracted kinetic parameters may diverge between polarities due to reaction hysteresis, phase transformations and concentration-dependent transport properties.
3. Reading a GITT Voltage–Time Curve
A standard GITT curve presents a staircase profile. Each step corresponds to one current pulse plus an open-circuit relaxation segment.
- During charging: Voltage rises under current and falls toward the relaxed quasi-equilibrium value after current cutoff.
- During discharge: The opposite trend occurs.
Two core voltage terms used in the classic simplified GITT equation:
- ΔEₛ: Quasi-equilibrium voltage change, the potential difference between the relaxed state before and after the pulse.
- ΔEₜ: Transient voltage change during the pulse, the polarisation-induced voltage shift after removing instantaneous ohmic contribution.
Consistent extraction of these two values from raw curves is essential for reliable analysis.
Importance of iR Drop
The abrupt voltage shift upon current switching is the iR drop. Directly using the full voltage swing over the entire pulse will introduce large errors, since part of the signal comes from resistance rather than solid-state diffusion. Not all fast voltage transients purely originate from ohmic resistance; charge-transfer kinetics and instrument sampling speed also affect the apparent jump. All pulses must be processed using the same well-documented voltage extraction routine.
4. GITT Test Program Setup
Reliable GITT relies on carefully selected pulse current, relaxation duration, sampling rate and voltage cutoffs. Optimised parameters depend on electrode chemistry, active mass loading, cell geometry and kinetic response.
Example GITT Test Parameters
| Parameter | Illustrative Setting | Key Consideration |
|---|---|---|
| Current pulse | 0.1 mA | For reference only; must match electrode capacity |
| Pulse duration | 5 min | Must satisfy short-time diffusion approximation |
| Relaxation duration | 30 min | Extend if voltage fails to stabilise |
| Recording interval | 10 s | Higher sampling rate recommended around current transitions |
| Voltage limits | Material-dependent | Stay within safe electrochemical window |
| Test temperature | Controlled | Record and maintain constant throughout measurement |
These values serve only as lab examples and cannot be treated as universal standards.
4.1 Current Selection
GITT generally uses low current to limit polarisation and minimise compositional disturbance within each pulse. Current selection depends on: active material mass, reversible capacity, C-rate, cell design, expected voltage response, polarisation and signal-to-noise ratio.
A specific current of 0.05 A/g means 50 mA per gram of active material, yet it does not translate to identical C-rates for different materials. A 150 mAh/g cathode and a 350 mAh/g anode operate at different effective C-rates under identical mass-specific current. Therefore, GITT current cannot be defined solely by a fixed A/g value.
4.2 Pulse Duration
The pulse must be short enough to satisfy the chosen diffusion model. For classic short-time approximation:
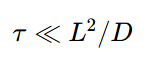
Where: τ = pulse duration (s), L = characteristic diffusion length (cm), D = chemical diffusion coefficient (cm²/s).
Physically, ion diffusion penetration depth during the pulse must be much smaller than the characteristic dimension of active particles. A shorter pulse than relaxation time does not automatically validate the approximation. A 5 min pulse 30 min rest may be experimentally convenient, but model validity still needs verification.
4.3 Relaxation Time
Relaxation enables voltage to approach quasi-equilibrium after each pulse. Required resting duration is material-specific. Materials with slow diffusion, phase transitions or prolonged voltage decay demand much longer relaxation. A fixed 30 min rest cannot guarantee equilibrium for all systems. Where feasible, monitor voltage decay rate and define a clear equilibrium criterion.
4.4 Data Recording Interval
Sampling speed must capture fast voltage transients. The first few seconds after switching current are critical for separating ohmic jump from slow polarisation. A fixed 10 s interval works for slow relaxation but may lose details of early transients. A practical strategy: faster sampling around current switching, moderate sampling during pulses, longer intervals for stable relaxation (where hardware permits). All sampling settings must be documented in reports.
5. GITT Diffusion Coefficient Formula
The widely adopted simplified equation derived from the Weppner–Huggins framework for chemical diffusion coefficient:
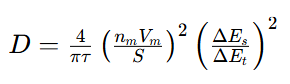
The simplified voltage-ratio equation assumes that the diffusion-related potential response is approximately linear with the square root of time over the selected pulse interval. When significant nonlinearity occurs, a slope-based analysis or a more appropriate electrochemical model should be considered. The selected fitting interval must exclude the initial resistance- and interfacial-polarisation-dominated response.
The more general slope-based form of the equation reads:
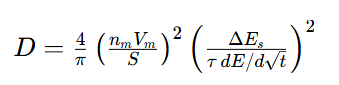
This formulation also assumes that the equilibrium potential change between neighbouring relaxed states is sufficiently small to justify finite-difference approximation.
| Symbol | Definition | Unit |
|---|---|---|
| D | Estimated chemical diffusion coefficient | cm²/s |
| the | Current pulse duration | s |
| nₘ | Moles of active material | mol |
| Vₘ | Molar volume of active material | cm³/mol |
| S | Model-defined electrode-electrolyte interfacial area | cm² |
| ΔEₛ | Approximately equilibrium potential change between adjacent and relaxed states | V |
| ΔEₜ | Transient pulse voltage change after removing ohmic contribution | V |
Alternative form expressed by effective diffusion length:
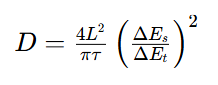
The effective diffusion length L = nₘVₘ/S represents the active-material volume-to-interfacial-area ratio in this formulation. It should not automatically be equated with electrode thickness or particle diameter. For ideal spherical particles with a defined total active surface area, the volume-to-area ratio is r/3, where r is the particle radius. The appropriate geometric relationship must be established before applying the diffusion equation.
Key Assumptions for the Simplified Equation
The simplified formula relies on the following assumptions:
- Valid short-time diffusion approximation
- Small compositional change per pulse
- Well-defined diffusion geometry
- Interpolate the Equatorial Powers of Response
- Minimal interference from non-diffusion polarisation
- Proper ohmic resistance correction
- Consistent definition of active volume and diffusion area
The voltage transient should demonstrate linear correlation with square root of time in the analysis window. Violation leads to heavily biased diffusion coefficients.
Why Electrode Area S Matters
Definition of S introduces major uncertainty. Many publications use geometric electrode disk area for simplicity; others adopt estimated electrochemically active surface area of particles. The two definitions are not interchangeable. Since S is squared in the equation, area uncertainty can substantially affect calculated D. For porous composite electrodes, real accessible particle surface area differs drastically from geometric area. Researchers must explicitly report the area definition used and avoid cross-comparison between results built on incompatible assumptions.
6. Step-by-Step GITT Data Analysis
Process raw voltage-time data consistently after test completion.
- Export raw data: Extract full time, current and voltage records including data around current switching events. Never calculate D from smoothed plot images.
- Segment pulses and relaxation: For each cycle, identify initial relaxed potential, pulse start/end time, voltage profile during pulse and final relaxed potential. Record pulse duration and actual applied current.
- Calculate voltage terms: Compute ΔEₛ from pre-pulse and post-pulse relaxed potentials. Extract ΔEₜ with a unified procedure that excludes instantaneous resistance contribution. Keep consistent sign conventions for charge and discharge.
- Validate diffusion model: Check whether pulse voltage response matches model expectations. For classic short-time analysis, plot voltage vs square root of time. Flag or discard segments failing the linearity criterion.
- Compute diffusion coefficient: Substitute measured voltage values and material parameters into the selected formula. Calculate D for each valid pulse individually.
- Plot results: Common visualisation: log(D) vs electrode potential, or D versus SOC / ion insertion degree. Separate charge and discharge curves as apparent diffusion differs between directions.
- Report uncertainty and model limits: Document electrode composition, cell configuration, mass loading, pulse parameters, temperature, voltage extraction method, formula, geometry/area assumptions and invalid data regions. Without these metadata, D values cannot be reproduced or compared.
7. GITT Result Interpretation for Typical Battery Materials
GITT reveals potential-dependent electrode kinetics, yet interpretation must account for material-specific electrochemistry.
7.1 Layered Oxide Cathodes (NMC/NCM, NCA)
Layered oxides are frequently characterised by GITT to map lithium transport across varying Li concentrations. Calculated D varies with potential, SOC, structural evolution and temperature. Variations in GITT-derived D help pinpoint kinetic-limited regions. However, voltage signals also contain charge-transfer polarisation and structural rearrangement. Not every fluctuation in D corresponds to intrinsic lithium mobility change.
7.2 LFP Cathodes
Lithium iron phosphate poses challenges for simplified GITT due to flat voltage plateaus and two-phase reaction. On the plateau, ΔEₛ between adjacent composition states becomes extremely small. Since ΔEₛ sits in the numerator of the GITT equation, tiny ΔEₛ yields artificially low D values. Such numbers cannot be directly interpreted as evidence of intrinsically sluggish Li⁺ diffusion. Complementary characterisation or alternative models are required.
7.3 Graphite Anodes
Graphite shows lithium staging transitions and flat potential regions during lithiation/delithiation. These phase transitions break the single-phase assumption of the simplified model. The relation between equilibrium potential, Li concentration and interfacial kinetics changes drastically across staging regions. GITT analysis for graphite requires careful assessment of phase behaviour and model applicability.
7.4 Silicon and Silicon-Carbon Anodes
Silicon-based electrodes suffer large volume expansion, complex reaction pathways and evolving interfaces during cycling. GITT can be used to estimate apparent lithium transport kinetics, yet analysis must consider: electrode volume variation, particle morphology, concentration-dependent diffusion, interfacial polarisation, mechanical stress and SEI evolution. Fixed diffusion geometry gradually loses validity as electrode structure degrades.
7.5 Zinc-Ion Battery Electrodes
GITT is widely used in aqueous zinc-ion research. Researchers must distinguish apparent electrochemical kinetics from intrinsic solid-state Zn²⁺ diffusion. Measured signals may involve proton co-participation, phase transformation and interfacial side reactions. GITT-derived D must be interpreted under the electrode’s actual reaction mechanism.
8. Common Errors in GITT Testing & Diffusion Calculation
- Overlong pulse duration: Violates short-time approximation and invalidates the simplified formula. Validate model fit instead of using fixed preset pulse length.
- Assuming fixed relaxation guarantees equilibrium: 30 min rest works for some materials but not all. If potential still drifts strongly at rest termination, ΔEₛ may not represent a sufficiently relaxed equilibrium voltage change. Inspect relaxation decay and define equilibrium criteria.
- Neglecting ohmic voltage correction: Including full instantaneous voltage jump into ΔEₜ distorts D. Apply consistent correction to remove resistance-related contribution.
- Wrong diffusion length or surface area: Particle geometry, active volume and interfacial area strongly affect D. Reporting geometric area without stating limitations causes misleading conclusions. Clearly define geometry and area assumptions.
- Treating plateau-region D as true intrinsic values: For LFP or graphite on flat plateaus, tiny ΔEₛ makes D unreliable. Flag these data points and use complementary characterisation.
- Presuming universal error direction for invalid pulses: Breaking model assumptions does not always overestimate D. D may be higher or lower depending on kinetics, geometry and equilibrium fitting. Avoid arbitrary correction factors without validated physical models.
- Cross-comparing data measured under inconsistent conditions: D values cannot be reliably compared if cell design, pulse protocol, equations or geometry assumptions differ. Keep all experimental and analysis settings identical for sample comparison.
9. Why Conventional GITT Diffusion Calculations Become Unreliable on Flat Voltage Plateaus
Flat equilibrium voltage plateaus can make diffusion coefficients calculated from the simplified GITT equation unreliable, particularly in materials undergoing phase transitions. A small equilibrium potential change does not necessarily indicate negligible ion transport. Researchers should distinguish limitations of the diffusion model from the usefulness of the underlying GITT voltage measurements.
The core simplified formula contains the (ΔEₛ/ΔEₜ)² term. When ΔEₛ approaches zero, calculated D trends toward zero even though ion transport remains active. Measurement noise and equilibrium fitting uncertainty become amplified. This issue originates from phase-transition materials: equilibrium potential is insensitive to composition change in the two-phase region, making the voltage-based D estimation poorly conditioned. Do not draw strong conclusions from near-zero D on voltage plateaus.
10. Can LS-GITT Improve Diffusion Coefficient Accuracy?
LS-GITT (Least-Squares Galvanostatic Intermittent Titration Technique) estimates solid-phase diffusivity by fitting measured voltage data to a physics-based diffusion model using least-squares optimisation. By utilizing more of the experimental voltage response, it can reduce certain limitations associated with simplified GITT equations. However, its accuracy still depends on model validity, parameter identifiability and data quality.
Potential benefits: better usage of transient data and reduced reliance on oversimplified assumptions, subject to the mathematical model selected. LS-GITT is not universally superior for all battery chemistries. Its performance depends on: appropriate physical model, raw data quality, parameter identifiability, treatment of interfacial kinetics, electrode geometry, noise level and fitting protocols. Multiphase materials with phase evolution require dedicated models accounting for phase transformation and reaction kinetics. Select analysis methods according to material chemistry rather than only calculation complexity.
11. Practical GITT Quality Checklist
| Checkpoint | Verification Item | Rationale |
|---|---|---|
| Current selection | Low-amplitude pulse with controlled polarisation | Preserves interpretable voltage response |
| Pulse duration | Compliance with selected diffusion model | Avoid invalid short-time approximation |
| Relaxation period | Thou shalt be received as an ephah. | Improves ΔEₛ reliability |
| Data acquisition | High sampling resolution around current switching | Captures fast voltage transients |
| Temperature | Stable and recorded test temperature | Diffusion kinetics are temperature-sensitive |
| Voltage correction | Consistent correction for ohmic transients | Accurate ΔEₜ extraction |
| Surface area | Explicit model-based interfacial area definition | Reduces uncertainty arising from geometry assumptions |
| Material geometry | Physically meaningful characteristic diffusion length | Produces physically meaningful D values |
| Flat plateaus | Identify regions with extremely small ΔEₛ | Prevent misleading near-zero D results |
| Replication | Repeat tests under identical conditions | Verify measurement reproducibility |
Recommended Reporting Practice
A complete GITT report should include raw experimental data and derived results. Minimum required content: full pulse/relaxation voltage-time traces, applied current, temperature, cell description and analysis workflow. For diffusion coefficient plots, state calculation assumptions and mark regions where model validity breaks down. Raw GITT curves often deliver richer insight than standalone D numbers.
GITT Data Analysis Method Selection Table
| Scenario | Recommended Analysis Method | Key Notes |
|---|---|---|
| Single-phase material, short pulse, good linearity of E vs √t | Simplified GITT | Verify diffusion geometry and voltage extraction protocol |
| Obvious nonlinearity in potential transient | Slope-based or model-based fitting | Isolate contributions from interfacial polarisation |
| Materials with flat voltage plateaus such as LFP | Phase-aware or alternative model | Near-zero calculated D should not be directly interpreted |
| Complex particle morphology, concentration-dependent diffusion | Physics-based fitting | Check parameter identifiability |
| High polarisation or prominent charge-transfer effects | Coupled electrochemical modelling | Do not attribute all voltage evolution solely to solid-state diffusion |
12. How CANRD Supports Battery Electrochemical Testing
Reliable ion diffusion characterisation hinges on electrode fabrication, cell assembly, measurement and data interpretation. CANRD serves battery R&D labs with research materials, electrode coating, cell assembly and electrochemical testing services.
Core offerings:
- Cathode and anode material preparation & evaluation
- Electrode slurry formulation and coating
- Coin cell and pouch cell assembly
- Electrode consistency validation
- Electrochemical performance characterisation
- GITT test design and data analysis support
- Battery failure analysis and process optimisation
Note: Please confirm with your technical/business team before public release whether GITT test design and data analysis support is formally offered as a commercial service, to avoid overstating service scope.
For teams screening multiple electrode formulations, consistent electrode manufacturing and cell assembly are critical. Poor batch-to-batch electrode consistency introduces artificial polarisation differences and complicates GITT interpretation. Combining controlled electrode fabrication with well-designed electrochemical testing yields reproducible, physically meaningful kinetic data.
Frequently Asked Questions
Q1: What does GITT measure in lithium-ion batteries?
GITT uses current pulses and voltage relaxation to evaluate electrode thermodynamics and transport behaviour. Under valid assumptions, it estimates the chemical diffusion coefficient of lithium within active electrode materials.
Q2: What is the difference between GITT and PITT?
GITT applies constant-current pulses followed by open-circuit relaxation. PITT uses potential steps and analyses resulting current transients. Both probe ion transport, yet they require distinct experimental setups and mathematical models.
Q3: What current should be used for GITT testing?
No universal current works for all electrodes. Select sufficiently low current based on active material capacity, C-rate, mass loading and polarisation behaviour.
Q4: How long should a GITT pulse last?
Pulse duration must match material kinetics and diffusion model. For classic short-time analysis, the pulse must satisfy the short-time diffusion criterion.
Q5: Is a 30-minute relaxation period sufficient?
Not always. Relaxation requirement is material-dependent. Verify whether voltage stabilises to an acceptable quasi-equilibrium state.
Q6: Why are GITT diffusion coefficients unreliable for LFP on voltage plateaus?
Equilibrium potential barely changes with composition on LFP plateaus. The extremely small ΔEₛ makes simplified D calculation unreliable and may generate artificially low values.
Q7: Can GITT be applied to zinc-ion batteries?
Yes. GITT is widely adopted in zinc-ion research, yet apparent diffusion data requires careful interpretation due to multiple ionic species, phase transitions and interfacial processes.
Q8: What is the difference between GITT and EIS?
GITT analyses voltage response to current pulses and relaxation. EIS characterises frequency response to small perturbations and is commonly used to resolve resistance and other electrochemical processes with fitted models.
Q9: Does a higher GITT diffusion coefficient always guarantee superior battery performance?
No. Battery performance also depends on electronic conductivity, electrode microstructure, charge-transfer kinetics, electrolyte transport, mechanical stability and cell design. GITT-derived D represents only one component of full electrochemical evaluation.
Q10: What metadata should be included when publishing GITT results?
Report electrode composition, active mass loading, test temperature, pulse current, pulse duration, relaxation time, voltage extraction protocol, diffusion equation, geometry and area assumptions, plus full voltage-time raw data whenever possible.
Conclusion
Galvanostatic Intermittent Titration Technique (GITT) is a powerful electrochemical characterisation method for ion transport kinetics and equilibrium potential behaviour in rechargeable battery electrodes. Its core advantage is the capability to map electrochemical response across a wide range of electrode composition or SOC using sequential controlled current pulses and relaxation.
Nevertheless, trustworthy diffusion coefficients rely on far more than raw test curves. Pulse length, current magnitude, relaxation conditions, material geometry, internal resistance and phase behaviour must all be considered holistically. The classic simplified GITT equation works only when its underlying assumptions hold and cannot be universally applied for all electrode systems.
For flat-plateau, multiphase or highly polarised materials, modified analytical workflows and complementary electrochemical techniques provide more robust insights. Ultimately, the purpose of GITT testing is not merely plotting diffusion coefficients, but building physically sound understanding of electrode transport to guide material development and performance optimisation.
Related Products & Services
Use Canrd products and R&D services to turn battery knowledge into practical experiments.
Coin Cell Case
ProductCoin cell cases for validating materials and electrochemical concepts from the article.
Use coin cell cases in your next test →Sodium Electrolyte
CategoryElectrolytes for sodium-ion battery research, compatibility tests, and cell validation.
Shop sodium electrolyte for validation →Cell Fabrication
ServiceGet support building dry cells, assembled cells, or custom formats for R&D validation.
Request cell fabrication support →Experimental Materials
CategoryBrowse materials for follow-up experiments, benchmarking, and product development.
Browse experimental battery materials →
