

 contact@canrd.com
 +86 18928276992
LFP Battery DCIR vs SOC: Why Internal Resistance Rises
Lithium iron phosphate (LFP) batteries often exhibit a bathtub-shaped DCIR–SOC curve: DCIR (Direct Current Internal Resistance) remains low and stable across the middle SOC window, and can increase toward the lower and upper limits of the tested SOC window.
Many engineers mistakenly attribute this resistance rise only to LFP cathode material limits. Measured DCIR aggregates contributions from cathode, graphite anode, electrolyte, tabs, cell contacts and test setup. It also includes apparent resistance from OCV shift during current pulses.
Understanding this curve helps battery researchers distinguish whether elevated resistance comes from raw material limitations, manufacturing defects, or simply test condition differences. This article breaks down measurement principles, root mechanisms, comparison with NMC cells, and practical troubleshooting using CANRD’s material-to-cell validation workflow.
1. What Is DCIR in LFP Battery Testing?
DCIR is an equivalent resistance calculated from voltage response triggered by controlled current pulses. For a discharge pulse starting from rest:
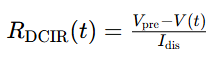
- Vpre: Voltage right before pulse
- V(t): Terminal voltage during pulse
- Idis: Discharge current magnitude
For a pulse starting from a nonzero current, use the current change, ΔI, and define the corresponding voltage reference.
Core rule: DCIR values cannot be compared directly unless test parameters are fully matched. Pulse duration, temperature, SOC, charge/discharge pulse direction all change results.
DCIR vs ACIR vs EIS
| Method | Measurement | Main use | Interpretation limit |
|---|---|---|---|
| ACIR (1 kHz) | Small AC single-frequency signal | Fast production screening | Cannot separate all resistance components |
| DCIR | Voltage response under current pulse | Pulse power & voltage sag prediction | Dependent on pulse settings |
| EIS | Impedance across frequency range | Interfacial & ion transport analysis | Physical interpretation requires validated analysis methods and supporting evidence |
A 1 kHz ACIR reading mainly captures ohmic resistance but is not pure ohmic resistance. Measurement timescale heavily impacts resistance readings for LFP/graphite pouch cells.
2. How to Measure Reliable DCIR vs SOC Curves
HPPC (Hybrid Pulse Power Characterization) is a widely used method for evaluating battery pulse power capability. HPPC is not universal; pulse length, rest interval and current ratios vary across EV testing standards.
Practical Lab Workflow
- Measure reference capacity under fixed temperature, C-rate and voltage cutoffs
- Set target SOC, track charge throughput including capacity consumed by prior pulses
- Stabilize cell temperature and voltage with defined rest criteria
- Apply pulse, log high-resolution current & voltage data
- Calculate DCIR at fixed timestamps (e.g. 1s and 10s DCIR separately)
- Repeat across usable SOC window, run charge and discharge pulses independently
Important note: If pulses trigger voltage cutoff or current clipping at SOC boundaries, flag this data. It cannot be compared with normal uninterrupted pulse results.
Recommended Reporting Parameters for DCIR Test Reports
Cell ID, chemistry, sample aging history, reference capacity, test temperature, SOC preparation method, pulse direction, pulse current in amperes, C-rate and its capacity basis, actual current waveform, pulse duration, rest stabilization criteria, four-wire sensing setup, voltage sampling time or averaging window, acquisition rate, fixture pressure, voltage cutoff events.
Four-wire sensing reduces errors caused by lead resistance and external contact voltage drops, provided the voltage-sensing points are correctly positioned. It cannot eliminate all contact-related measurement issues.
3. Why LFP DCIR Can Increase At Low SOC and High SOC
The bathtub curve comes from overlapping electrochemical polarization and OCV measurement effects, and the curve shape is often asymmetric.
3.1 Flat OCV Plateau at Middle SOC
Within the middle SOC plateau region, LFP operates via phase transition between LiFePO₄ and FePO₄, creating a flat cathode potential. In full LFP-graphite cells, equilibrium voltage barely shifts for small SOC changes during short pulses in this plateau region.
This flat plateau reduces apparent voltage drift. However, flat voltage does not automatically mean low charge-transfer resistance. Carbon coating, electrode porosity and electrolyte wetting strongly influence kinetic performance.
3.2 Higher Polarization Near SOC Boundaries
At high or low SOC, electrodes reach limiting operating states. Depending on pulse current, duration and electrode design, stronger lithium concentration gradients may develop, alongside:
- Larger interfacial overpotential
- Reduced usable reaction capacity
- Bigger terminal voltage swing during pulse
Full-cell DCIR behaviour depends on both cathode and graphite anode. Discharge pulses and charge pulses at the same SOC produce different voltage responses and constraints.
3.3 Steep OCV Slope Creates Apparent Resistance
When a pulse runs, SOC continuously changes. Regions with steep OCV vs SOC slope add extra voltage shift, which registers as apparent DCIR. This is not real dissipative ohmic heating loss.
Longer pulses amplify this effect under a local OCV-slope approximation. Longer pulses may cross regions with differing OCV slopes, so resistance does not always rise linearly with pulse duration.
4. Components of Pulse Voltage Response

This conceptual breakdown uses positive magnitude values for polarization drop to avoid sign ambiguity.
- Fast ohmic response: current collectors, tabs, welds, electrolyte and contact resistance
- Interfacial polarization: SEI film, charge transfer and double-layer capacitance
- Transport polarization: electrolyte ion transport and solid-state lithium diffusion
- Apparent OCV resistance: voltage drift caused by SOC change during pulse
RC equivalent circuits are helpful for fitting, but fitted RC terms cannot be simply assigned to one single electrode or physical mechanism.
5. LFP vs NMC DCIR-SOC Characteristics
NMC cathode has a more sloped OCV profile compared with flat-plateau LFP. But NMC cells can also show bathtub-style DCIR curves, with higher resistance at low SOC and rising resistance at high SOC.
| Feature | LFP/graphite | NMC/graphite |
|---|---|---|
| OCV shape | Long flat central tray | Gradually sloping profile |
| Typical DCIR trend | Broad low-resistance valley, can increase toward SOC limits | Low-SOC laugh, minimum width, possible high-SOC increases |
| Key influencing factors | Phase transformation, carbon coating | Composition-dependent structural kinetics |
| Full cell variables | Graphite balance, porosity, electrolyte & manufacturing | Same full-cell factors apply |
Resistance comparison requires matched temperature, pulse definition, capacity basis, cell geometry and aging state. Different-capacity cells can still be tested for performance comparison, but material-mechanism conclusions require consistent cell design and capacity reference.
6. CANRD Case: Connecting LFP Material Screening with Pouch-Cell Performance
In a CANRD evaluation project using customer-supplied LFP, powder characterization and coin half-cell testing were followed by stacked LFP/graphite pouch-cell fabrication and rate-capability testing. These results provide context for subsequent pulse-resistance evaluation; they do not constitute a measured DCIR–SOC dataset.
| Evaluation Stage | Parameter | Result & Notes |
|---|---|---|
| Powder characterization | Dv50 | 0.98 µm |
| Powder characterization | BET specific surface area | 12.9 m²/g |
| Coin half-cell testing | Average first-discharge specific capacity, three samples | 152.3 mAh/g, average across three samples |
| Coin half-cell testing | Reported average initial Coulombic efficiency | 97.0%, reported value for three samples |
| Pouch electrode preparation | Cathode coating mass per side | 10.74 mg/cm², single-side coating loading |
| Pouch electrode preparation | Cathode compacted density | 2.58 g/cm³ |
| Pouch rate testing, sample 8 | Discharge capacity at 0.2C | 990.1 mAh, single pouch sample 8 |
| Pouch rate testing, sample 8 | Discharge capacity at 3C | 818.1 mAh, single pouch sample 8 |
Pouch rate test conditions: 25°C, 0.5C charging, discharge at specified rates. The lower delivered capacity at higher discharge rates is consistent with increased polarization and earlier arrival at the voltage cutoff, but does not by itself identify the underlying mechanism.
A simplified calculation demonstrates OCV slope impact: For a 10-second discharge pulse at 1C, the SOC decreases by approximately 0.278 percentage points, provided the C-rate and SOC are defined using the same reference capacity. This is a calculated illustration, not a measured CANRD pulse-test result.
7. Troubleshooting Abnormal LFP DCIR-SOC Curves.
An unexpected curve shape is a diagnostic clue, not direct proof of a single failure mode.
| Observation | Possible Root Cause | Recommended Checks |
|---|---|---|
| High resistance across all SOC | Low temperature, poor contact, cell aging, electrolyte degradation | Verify temperature, four-wire sensing and repeat tests |
| 1s DCIR stable, long-pulse DCIR increases | Slow interfacial or solid diffusion polarization | EIS, relaxation test and rate performance comparison |
| Sharp resistance spike at low SOC | End-of-range polarization, SOC calculation error, voltage cutoff | Check reference capacity and raw pulse waveform |
| Large gap between charge & discharge DCIR | Kinetics hysteresis or inconsistent pre-test SOC conditioning | Unify cell rest and SOC preparation procedure |
| High test scatter | Fixture pressure variation, temperature drift, unstable sampling | Repeat with fixed wiring and thermal control |
For LFP electrode R&D, optimize conductive additive dispersion, binder distribution, coating loading and calendering density. Increasing electrode compaction can improve volumetric energy density within an appropriate process window. Excessive calendering, however, may reduce pore accessibility, hinder electrolyte wetting and ion transport, and compromise rate performance.
Researchers screening formulations can use LFP / LiFePO₄(D-3) Cathode Materials as part of a controlled evaluation, while keeping the rest of the cell design consistent.
8. DCIR Impact on Battery Power & Aging
Discharge voltage approximation:

This expression uses the pre-pulse terminal voltage and a DCIR value measured at the same pulse duration and under comparable conditions. It should not be extrapolated directly to arbitrary currents or longer operating periods.
Higher DCIR causes larger voltage sag under load. Near SOC limits, the voltage margin shrinks, reducing maximum deliverable current before hitting cut-off.
For charging, the available voltage margin becomes smaller near the upper limit. Low temperature and high SOC can introduce additional charging constraints, so resistance alone is insufficient to establish a safe charge-current limit.
For aging assessment, compare DCIR under fully matched test conditions. Rising DCIR signals power decay, yet it cannot independently identify degradation mechanisms or quantify remaining capacity.
FAQ
Q1: Why does LFP resistance increase at low SOC?
A1: Near the lower operating boundary, electrode polarization may increase and the local OCV slope can become steeper. Both factors can amplify voltage drop during discharge pulses.
Q2: Does every LFP cell produce a bathtub-shaped DCIR curve?
A2: No. Curve shape depends on electrode formulation, temperature, aging state, pulse direction and SOC test window. The high-SOC and low-SOC resistance rise can be asymmetric.
Q3: Can 1 kHz ACIR replace 10-second DCIR measurement?
A3: No. ACIR serves for fast batch screening, while 10s DCIR captures time-dependent polarization critical for pulse power simulation.
Q4: Can coin half-cell data predict pouch cell DCIR?
A4: Coin cells reveal material behavior under a defined electrode formulation and test configuration, but coin cells are also affected by recipe, loading, electrolyte, lithium counter electrode and assembly. Geometry, counter electrode and current distribution differ from pouch full cells. Full pouch pulse testing remains mandatory.
Closing
Interpreting LFP DCIR vs SOC requires standardized test protocols and full-cell system thinking. The flat LFP plateau partly explains the bathtub curve, while electrode kinetics, manufacturing quality and OCV shift dominate measured resistance readings.
CANRD delivers end-to-end battery research support: cathode material supply, custom electrode coating and research pouch cell fabrication. If your team needs LFP DCIR testing and cell validation, share your target capacity, electrode specs, temperature and pulse requirements via our contact page.
Productos y servicios relacionados
Use productos y servicios de I+D de Canrd para convertir conocimiento de baterias en experimentos practicos.
Carcasa coin cell
ProductoCarcasas coin cell para validar materiales y conceptos electroquimicos del articulo.
Usar carcasas coin cell en su proxima prueba →Electrolito de sodio
CategoriaElectrolitos para investigacion sodium-ion, pruebas de compatibilidad y validacion de celdas.
Comprar electrolito de sodio para validacion →Fabricacion de celdas
ServicioObtenga soporte para construir celdas secas, celdas ensambladas o formatos personalizados.
Solicitar soporte de fabricacion de celdas →Materiales experimentales
CategoriaExplore materiales para experimentos posteriores, benchmarking y desarrollo de producto.
Ver materiales experimentales de bateria →
