

 contact@canrd.com
 +86 18928276992
Band Gap Engineering: What Makes Band Gap Increase or Decrease?
Band gap engineering modifies a material’s electronic structure to tune light absorption, charge transport and interfacial behavior. A spectral shift in absorption edge is not automatically proof of true band gap change. Carrier filling, defects, excitons and measurement artifacts can produce similar spectral shifts. For semiconductor, photoelectrode and battery material researchers, reliable band gap tuning requires selecting the right mechanism and validating experimental results.
1. What Is the Band Gap?
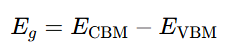
The band gap E_g is the energy difference between the conduction band minimum (CBM) and valence band maximum (VBM).
Ideal semiconductors contain no electronic states inside this gap. Real materials show mid-gap localized states from vacancies, impurities, surfaces or defects.
Direct vs indirect band gap
- Direct band gap: VBM and CBM share the same k-point. Optical transitions happen without phonon assistance; ideal for light emission.
- Indirect band gap: VBM and CBM sit at different k-points. Transitions require phonon participation; widely used for absorbers and electronic materials.
2. Does a Narrower Band Gap Equal Higher Conductivity?
No. A smaller band gap eases thermal electron excitation, but conductivity depends on carrier concentration and mobility, not only E_g.
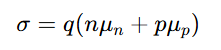
This expression describes conventional electron and hole conduction. In some transition-metal electrode materials, such as LiFePO₄, electronic transport involves small-polaron hopping, so conductivity activation energy should not be equated with band gap.
Doping, grain boundaries, traps and structural disorder can change conductivity without a substantial change in the host band gap.
For battery electrodes, conductivity also relies on conductive additive dispersion, particle contact and current collector interfaces. Band gap alone cannot predict electrode performance.
3. Core Tuning Mechanisms: What Alters Band Gap and Optical Transitions
These methods can alter the electronic band gap, optical transition energies or both.
3.1 Quantum confinement (smaller particles / thinner layers)
When material dimensions approach the exciton Bohr radius, energy levels shift. Smaller nanocrystals often produce blue shift. Not a universal <10 nm rule. Classic example: bulk MoS₂ (indirect gap) transforms to monolayer direct-gap semiconductor with strong photoluminescence.
Key note: Blue shift alone cannot confirm quantum confinement. Verify particle/layer thickness independently.
3.2 Alloying & chemical substitution
Changing composition modifies orbital energies and bonding. Band gap bowing creates nonlinear composition dependence. Alloying may also switch between direct/indirect band gap. Physical powder mixing does not by itself establish a homogeneous solid-solution alloy.
Key note: Pair optical data with XRD and compositional analysis before assigning shifts to alloy band gap engineering.
3.3 Strain engineering (tensile / compressive strain)
Strain modifies bond lengths, angles and crystal symmetry. The myth “compression widens gap, tension narrows gap” is not universal. Results depend on crystal phase, strain direction and magnitude. Strain tuning can be reversible within the elastic regime, provided no irreversible structural or interfacial changes occur.
3.4 Doping: Burstein–Moss effect & band gap renormalization
Low doping mainly adjusts carrier density and Fermi level, with minimal intrinsic band gap change. Degenerate n-type doping creates the Burstein–Moss effect: Occupied conduction-band states block low-energy interband transitions through Pauli exclusion. This optical shift does not prove a wider fundamental band gap. At heavy doping, many-body effects cause band gap renormalization. Defect states may add low-energy absorption tails.
3.5 Electric field modulation
Electric fields can shift optical transitions through the quantum-confined Stark effect and can also modify the electronic band gap in certain layered materials. The interpretation depends on the material and device structure; an optical red shift alone does not establish fundamental band gap narrowing.
3.6 Temperature
Most semiconductors show reduced band gap with rising temperature, described by the Varshni equation, driven by electron-phonon coupling and thermal expansion. Phase transitions can reverse this trend. Always control sample temperature during optical testing.
4. Band Gap Characterization: UV-Vis, PL, UPS
These techniques deliver different information and cannot replace each other.
- UV-Vis / Broadcast reflection Tauc plat: Estimates optical band gap. Scattering, sample preparation and Tauc exponent selection introduce uncertainty. Tauc extrapolation was originally built for amorphous semiconductors and should not be blindly applied to crystalline or multi-phase samples.
- Photoluminescence (PL): Detects radiative recombination. PL peak energy often reflects excitons or defects rather than fundamental band gap. Use as complementary data instead of standalone proof.
- UPS (ultraviolet photoelectron spectroscopy): Measures occupied valence band states and work function. It cannot directly measure CBM. Combining UPS valence edge with optical gap to calculate CBM carries risks, especially for materials with strong exciton binding energy.
5. Band Gap Engineering in Battery Materials Research
A narrower optical band gap does not automatically deliver better battery electrodes. Battery performance depends on reversible redox chemistry, ion diffusion, phase evolution, electrolyte compatibility, electrode porosity and manufacturing quality.
Carbon coating often improves electronic conduction by providing conductive pathways and improving particle contacts. This improvement alone does not demonstrate narrowing of the active material’s intrinsic band gap; surface reactions and interfacial electronic changes require separate evaluation.
For battery electrodes, report lithiation state, state of charge, cycling history and sample handling conditions. Comparisons should use equivalent material states because electrochemical cycling can change composition, phase and electronic structure.
Practical validation workflow
- Composition & crystal phase: XRD elemental analysis
- Morphology & surface area: SEM/TEM, particle size, BET
- Electronic conduction: powder resistivity or electrode resistance
- Electrochemical performance: capacity, rate capability, cycling, CV, EIS
- Reproducibility:matched electrode fabrication and replicate cell tests
EIS probes frequency-dependent impedance associated with conduction, interfacial reactions and mass transport. It does not directly measure band gap, and assigning individual features requires a physically justified model.
Compare electrodes at matched active-material loading, conductive additive and binder contents, thickness, porosity and processing conditions. Use replicate cells under the same electrolyte, voltage window, temperature and cycling protocol.
6. How to Validate Reliable Band Gap Changes
- Distinguish terms: optical gap, emission energy, fundamental band gap
- Confirm sample identity: phase, composition, particle morphology and sample history
- Stabilize measurement conditions: temperature, sample preparation, data processing
- Rule out alternative explanations: scattering, defects, carrier filling, excitons, secondary phases
- Validate target application: test transport, optical or electrochemical performance
For battery R&D, matched electrodes and replicate cells separate material effects from fabrication variability.
7. FAQ
Q1: Does reducing particle size always increase band gap?
A: No. Confinement only works at material-specific length scales. Defects, surface chemistry and phase changes can dominate optical signals.
Q2: Does compressive strain always widen band gap?
A: No. Both compressive and tensile strain can increase or decrease band gap, determined by crystal structure, loading orientation and strain magnitude.
Q3: Can doping raise conductivity without changing band gap?
A: Yes. Higher mobile carrier concentration improves conductivity while intrinsic band gap stays nearly unchanged.
Q4: Does red-shifted absorption edge confirm band gap narrowing?
A: No. Defects, excitons, secondary phases, scattering and data analysis choices can produce red shifts that do not represent fundamental band gap narrowing. Complementary measurements are needed to support the proposed mechanism.
Q5: Which measurement should researchers start with?
A: Start with UV–Vis or diffuse reflectance for optical gap screening. Add PL for emission behavior and UPS for valence band / work function. Pair with structural and electrical tests based on your research question.
Q6: Can band gap predict battery capacity or cycle life?
A: No. Band gap describes electronic structure. Capacity and cycling stability require full electrochemical cell validation under controlled electrode conditions.
8. Conclusion
Band gap engineering delivers value only when tuning mechanisms link to repeatable measurements and real application performance. For battery materials, electronic structure analysis must be combined with morphology, composition, resistance and electrochemical testing.
CANRD supports battery material evaluation through physicochemical characterization, custom electrode fabrication, cell assembly and electrochemical testing. Share your material chemistry, modification strategy and target metrics to discuss an appropriate evaluation plan.
Productos y servicios relacionados
Use productos y servicios de I+D de Canrd para convertir conocimiento de baterias en experimentos practicos.
Carcasa coin cell
ProductoCarcasas coin cell para validar materiales y conceptos electroquimicos del articulo.
Usar carcasas coin cell en su proxima prueba →Electrolito de sodio
CategoriaElectrolitos para investigacion sodium-ion, pruebas de compatibilidad y validacion de celdas.
Comprar electrolito de sodio para validacion →Fabricacion de celdas
ServicioObtenga soporte para construir celdas secas, celdas ensambladas o formatos personalizados.
Solicitar soporte de fabricacion de celdas →Materiales experimentales
CategoriaExplore materiales para experimentos posteriores, benchmarking y desarrollo de producto.
Ver materiales experimentales de bateria →
