

 contact@canrd.com
 +86 18928276992
Glass Transition Temperature (Tg): DSC vs DMA Testing Guide
Glass Transition Temperature (Tg) is a characteristic temperature associated with a major change in molecular relaxation behavior in amorphous polymers and amorphous regions of semicrystalline materials. It provides insight into temperature-dependent stiffness, flexibility and viscoelasticity, and may also influence ion transport in certain polymer electrolyte systems.
For battery R&D, Tg is critical to evaluate polymer binders, polymer electrolytes, separator coatings, adhesives and flexible packaging films. It explains polymer brittleness at low temperature, temperature-dependent mechanical degradation, and segmental mobility that contributes to ion transport in many solvating polymer electrolytes.
1. What Is Glass Transition Temperature (Tg)?
Glass transition is a kinetic, temperature-triggered shift in molecular mobility, driven by cooperative segmental motion of polymer chains. It occurs over a temperature range, not a single equilibrium point. Tg is the characteristic temperature defined by standardized test rules.
- Below Tg (glassy state): Cooperative segment relaxation slows sharply. Materials show high modulus, high rigidity, low ductility and higher brittleness risk. Local molecular vibrations still exist and do not fully stop.
- Above Tg (increased segmental mobility): Cooperative segmental relaxation becomes faster, typically resulting in reduced stiffness and increased viscoelastic deformation. Depending on molecular weight, crosslinking and crystallinity, the material may exhibit rubber-like behavior, viscous flow or continued mechanical support from crystalline regions.
Key distinction: Glass transition is NOT crystal melting. It only affects amorphous polymer regions.
2. Tg vs Tm: Core Differences
| Property | Glass Transition (Tg) | Melting Temperature (Tm) |
|---|---|---|
| Physical event | Change in molecular relaxation & segment mobility | Melting of ordered crystalline phase |
| Material zone | Amorphous regions | Crystalline regions |
| Transition type | Kinetic, time-dependent | Equilibrium first-order phase transition |
| DSC signal | Heat capacity step change | Sharp endothermic melting peak |
| Measurement impact | Strongly affected by heating/cooling rate | Influenced by morphology and thermal lag |
Semicrystalline battery polymers (e.g., polyolefin separators) can display both Tg and Tm. Never interchange Tg, Tm or thermal decomposition temperature.
3. Molecular Mechanism of Glass Transition
Glass transition originates from α-relaxation (alpha relaxation), the cooperative movement of polymer chain segments. When cooling, structural relaxation time rises. Once relaxation time matches the test observation timescale, glass transition takes place.
Tg is a kinetic transition:
- Faster cooling rate → higher apparent Tg
- Measured Tg varies with thermal history, annealing, moisture, solvent content and test frequency All test conditions must be documented for valid data comparison.
4. Key Factors Affecting Tg
- Polymer backbone flexibility: Flexible backbones reduce Tg. Example: PDMS has an ultra-low Tg (~ −120 °C). Rigid aromatic backbones restrict segment motion and often increase Tg.
- Side groups: Bulky or polar side groups increase intermolecular restriction and generally often increase Tg.
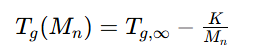
- Molecular weight: Tg rises with molecular weight at low Mn and plateaus to a maximum limiting value at high molecular weight (Fox–Flory rule).
- Crosslink density: Higher crosslinking limits chain rearrangement and often increases Tg, widely used in thermoset adhesives and polymer networks.
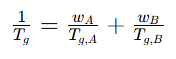
- Copolymer composition: Compositionally homogeneous random copolymers generally exhibit one principal glass transition, while phase-separated block copolymers and immiscible polymer blends may display multiple glass transitions. The number and visibility of transitions depend on phase behavior, domain composition and measurement sensitivity.
- Plasticizer, solvent & moisture: Plasticizers, residual solvent and water increase chain mobility and lower Tg. Critical for battery materials: electrolyte uptake can alter Tg significantly.
- Pressure & thermal history: Higher pressure restricts molecular motion and often increases Tg. Physical aging changes DSC transition profiles.
5. Classic Tg Prediction Models
All models require specific assumptions and cannot be universally applied.
1. Fox–Flory Equation: Describes molecular weight dependence of Tg
2. Fox Equation: Estimate Tg of miscible blends/copolymers (temperature in Kelvin)
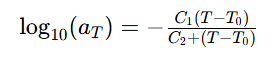
3. WLF Equation: Time-temperature superposition for viscoelastic master curves near Tg
6. Tg Measurement: DSC vs DMA
6.1 DSC (Differential Scanning Calorimetry)
DSC detects heat capacity change during glass transition, shown as a baseline step. Common Tg evaluation criteria:
- Extrapolated onset temperature
- Midpoint temperature (most widely reported)
- Inflection temperature
DSC glass transition temperatures should be assigned using a clearly defined evaluation criterion, such as the midpoint, extrapolated onset or inflection temperature, as appropriate to the measurement protocol. ASTM E1356 provides a standardized framework for determining Tg by DSC.
Test notes: Control heating rate, sample mass, thermal history. Enthalpy overshoot often appears in physically aged samples. A second heating scan is often used to reduce differences caused by previous thermal history and improve sample comparability. However, this approach is appropriate only when the first heating and controlled cooling process do not introduce significant irreversible chemical or structural changes.
6.2 DMA (Dynamic Mechanical Analysis)
DMA measures viscoelastic response under oscillatory strain. Key outputs:
- Storage Modulus (E')
- Loss Modulus (E'')
- Loss factor tan δ = E''/E'
DMA can identify the glass transition region using the onset of storage modulus (E') decrease, the loss modulus (E'') peak or the tan δ peak. These criteria generally yield different temperatures. The selected Tg criterion, test frequency and specimen geometry should always be reported.
Why DSC and DMA Tg differ: DSC measures thermal heat capacity change; DMA measures mechanical relaxation dependent on test frequency. Always report test method when publishing Tg.
7. How to Select DSC or DMA for Battery Polymers
| Comparison | DSC | DMA |
|---|---|---|
| Measured signal | Heat flow & heat capacity | Modular & Dæmon |
| Tg marker | Baseline step | Modulus drop / tan δ peak |
| Best for | Routine thermal screening, formulation comparison | Temperature-dependent stiffness, coating/adhesive mechanical performance |
| Limitation | Weak Tg step hard to detect | Results depend on frequency, specimen geometry |
Recommendation: Use DSC for thermal transition screening. Use DMA when focusing on mechanical flexibility and damping. Combine both for complementary thermal and mechanical characterization.
8. Tg Application in Battery Material Research
| Battery Polymer Component | Primary Tg Research Significance | Recommended Complementary Tests |
|---|---|---|
| PVDF, CMC, SBR, PAA binders | Polymer phase flexibility, relaxation and thermomechanical behavior | DSC, DMA, adhesion testing, swelling test |
| Solid-state polymer electrolytes | Relationship between chain dynamics and ion transport | DSC, EIS, DMA |
| Gel polymer electrolytes | Electrolyte uptake, plasticization and mechanical stability | DSC, DMA, liquid uptake measurement, EIS |
| Separator polymer coatings | Thermomechanical stability and coating integrity | DSC, DMA, thermal shrinkage test |
| Battery encapsulation adhesives & sealants | Rigidity, viscoelasticity and sealing reliability under thermal cycling | DSC, DMA, peel strength or sealing performance test |
For PVDF and other semicrystalline binders, Tg only describes relaxation of amorphous domains. For hydrophilic binders such as CMC and PAA, moisture content, salt form and measurement conditions can drastically alter measured values. Tg alone should not be used to rank the performance of these binders.
8.1 Electrode Binders (PVDF, CMC, SBR, PAA)
Tg describes temperature-dependent binder flexibility, affecting stress relief during electrode expansion/contraction. Tg alone cannot decide binder performance; adhesion, electrolyte resistance, swelling and coating uniformity also matter.
8.2 Polymer & Gel Electrolytes
In many solvating polymer electrolytes, ionic transport is coupled to polymer segmental dynamics. A lower Tg can facilitate molecular mobility and may improve ionic conductivity under suitable conditions. However, ion transport in gel, composite and other specialized polymer electrolytes may involve additional mechanisms, so Tg alone cannot predict electrolyte conductivity or electrochemical performance.
8.3 Separator Coatings
Tg characterizes polymer coating thermal-mechanical behavior. It cannot replace separator shutdown temperature, melting point or thermal shrinkage testing.
8.4 Adhesives & Flexible Packaging
Tg helps evaluate dimensional stability and adhesion under thermal cycling for pouch cell packaging and module sealants.
9. Standard Tg Testing Workflow for Battery Polymers
- Define application scenario: binder / electrolyte / coating / adhesive and target operating temperature window
- Record sample state: grade, thermal history, dry state or electrolyte-soaked condition
- Select DSC, DMA or dual testing
- Standardize test parameters (heating rate, frequency, sample geometry)
- Clarify Tg definition (DSC midpoint / DMA tan δ peak etc.)
- Correlate Tg data with real component performance
- Verify repeatability and document measurement uncertainty
10. Common Tg Interpretation Mistakes
- Confusing Tg with Tm: Tg is amorphous relaxation; Tm is crystal melting
- Believing molecular motion stops fully below Tg
- Directly comparing DSC Tg and DMA Tg without marking test method
- Ignoring heating rate and thermal aging effects
- Assuming higher/lower Tg automatically equals superior battery performance
- Blindly applying Fox, Fox–Flory or WLF to phase-separated heterogeneous systems
FAQ
Q1: Simple definition of Tg?
Tg is the temperature zone where amorphous polymer stiffness and chain mobility change dramatically, controlled by molecular relaxation relative to test time scale.
Q2: Can DSC measure Tg?
Yes. DSC captures heat capacity step; Tg is reported by onset, midpoint or inflection criteria. ASTM E1356 defines the standard DSC methodology.
Q3: Is DMA more sensitive than DSC?
DMA shows higher sensitivity for samples with weak DSC heat-capacity step, as it detects mechanical relaxation.
Q4: Does crosslinking raise Tg?
Higher crosslink density usually restricts chain motion and often increases Tg, subject to network chemistry and curing level.
Q5: What needs to be included in a Tg test report?
Sample condition, instrument type, heating rate, thermal pretreatment, Tg calculation criterion; DMA needs frequency and specimen geometry.
Conclusion
Glass Transition Temperature (Tg) is an important characterization parameter to characterize amorphous polymer thermal-mechanical behavior for battery components. Since Tg is method-dependent and kinetic, test conditions must be fully reported.
Material qualification workflow: Substitute Large Northern Region → Left Current District (Red/Drp) → Yellow white / Heavyweights → Electromagnetic →
Combining Tg testing with application-focused performance tests supports rational polymer selection and formulation optimization for lithium and next-generation batteries.
About CANRD
CANRD provides battery R&D support including custom electrode fabrication, coin/pouch cell prototyping and material characterization services. For polymer-based battery components, thermal properties should be tested together with processability, electrochemical compatibility and cell performance.
Verwandte Produkte und Services
Nutzen Sie Canrd-Produkte und R&D-Services, um Batteriewissen in praktische Experimente umzusetzen.
Coin-Cell-Gehäuse
ProduktCoin-Cell-Gehäuse zur Validierung von Materialien und elektrochemischen Konzepten aus dem Artikel.
Coin-Cell-Gehäuse im nächsten Test nutzen →Natrium-Elektrolyt
KategorieElektrolyte für Natrium-Ionen-Batterieforschung, Kompatibilitätstests und Zellvalidierung.
Natrium-Elektrolyt für Validierung kaufen →Zellfertigung
ServiceUnterstützung beim Bau von Trockenzellen, montierten Zellen oder kundenspezifischen Formaten.
Zellfertigungsunterstützung anfragen →Experimentelle Materialien
KategorieMaterialien für Folgeexperimente, Benchmarking und Produktentwicklung ansehen.
Experimentelle Batteriematerialien ansehen →
