

 contact@canrd.com
 +86 18928276992
 Crystallinity vs Crystallite Size vs Grain Size: XRD Analysis Guide
When interpreting XRD, DSC, SEM, and EBSD characterization results, researchers frequently confuse crystallinity, crystal quality, crystallite size and grain size. Although all relate to the crystalline state of solids, they characterize independent structural features.
A material may present these scenarios:
- High crystallinity but tiny crystals
- Large grains with unchanged crystallinity
- Identical crystalline fraction but drastically different defect concentration
- Micron-sized grains observed under SEM while XRD gives crystallite size of only tens of nanometers
Thus, statements like “higher crystallinity equals larger grains” or “sharper XRD peaks always represent higher crystallinity” are incorrect. This article clarifies definitions, characterization principles and typical misinterpretations, targeting battery and advanced material research.
1. Four Core Structural Parameters to Distinguish
| Parameter | Description | Typical Unit | Main Characterization Tools |
|---|---|---|---|
| Crystallinity / Crystalline Fraction | Proportion of ordered crystalline phase within the whole sample | % | DSC, XRD/WAXD |
| Crystal Quality / Crystalline Perfection | Order degree of crystal lattice, reflecting lattice distortion and defect level | Qualitative / indirect quantitative | XRD, Raman, TEM |
| Grain Size | Physical dimension of grains defined by crystal orientation | nm, μm | SEM, EBSD, TEM |
| Crystallite Size | Size of coherent diffraction domains | nm | XRD peak broadening analysis |
These parameters correlate but cannot substitute one another. Crystalline fraction, ordered domain size and lattice perfection are independent structural variables and may evolve separately under identical processing conditions.
2. Crystallinity (Crystalline Fraction)
Crystallinity quantifies the percentage of crystalline regions relative to amorphous regions in a material:

This term is most applicable to semi-crystalline substances: polymers, partially crystallized glass, partial-order carbon materials.
Key point: Crystallinity only describes how much crystalline phase exists, not how large the crystals are. Same crystalline fraction can originate from few large crystals or numerous tiny nanocrystals. Annealing may raise crystallinity without changing crystal morphology uniquely.
Application scope
For semi-crystalline polymers, crystallinity strongly influences stiffness, thermal resistance, barrier properties and degradation behavior, together with crystal morphology, molecular orientation and other structural factors. For fully crystalline ceramics or polycrystalline metals, crystallinity is close to 100%. In such cases, grain size, dislocation density, microstrain and texture are more meaningful comparison indicators.
3. What is Crystal Quality?
“Good crystal quality” is a vague qualitative phrase without unified quantitative definition. In papers, it may refer to:
- Narrow XRD diffraction peaks
- Low lattice disorder and microstrain
- Low defect density
- Large coherent diffraction domains
✅ Writing suggestion: Avoid standalone “good crystallinity”. Replace it with measurable parameters:
- Sample B shows narrower XRD peaks and lower fitted microstrain.
- DSC data shows crystalline fraction rises from 18% to 31%.
- EBSD shows average grain size increases from 3.2 μm to 4.7 μm.
Crystal Quality: a qualitative concept that may be described using parameters such as microstrain, defect density, mosaicity, coherent domain size and lattice disorder, depending on the material and technique.
4. Grain Size vs Crystallite Size – The Most Easily Confused Pair
Grain Size
A grain is a continuous physical domain with consistent crystal orientation, separated by grain boundaries. Measured by SEM, EBSD or TEM. EBSD identifies grains via crystallographic orientation difference and outputs grain diameter, grain size distribution and misorientation.
Crystallite Size
Crystallite size from XRD means the size of coherent diffraction domain: the length scale where periodic lattice maintains enough coherence to produce diffraction signals.
One physical grain may contain subgrains, low-angle boundaries and defect fields that limit the coherent diffraction length. Therefore, a single SEM/EBSD grain may contain several coherent diffraction domains.
👉 XRD crystallite size can be substantially smaller than SEM/EBSD grain size when one physical grain contains multiple coherent domains. This relationship is not universal.
Example: SEM grain size = 4.2 μm XRD coherent crystallite size =120 nm No contradiction — they describe structural features at different scales.
5. Independent Evolution of Crystallinity, Grain Size and Lattice Perfection
Different structural parameters are governed by distinct physical mechanisms:
- Crystallinity: controlled by nucleation, crystal growth, cooling rate and thermal history (how much amorphous phase transfers into crystal).
- Grain size: controlled by nucleation density, grain boundary migration, grain growth and recrystallization.
- Lattice perfection (crystal quality): controlled by vacancies, dislocations, stacking faults, residual stress and microstrain.
Two typical cases:
Case 1: Higher crystallinity with smaller crystals
Adding nucleating agents increases nucleation density. More crystal nuclei form simultaneously. The final crystalline fraction rises, while individual crystals stop growing earlier and become finer.
Case 2: Grain growth without crystallinity increase
For dense polycrystalline ceramics during sintering, small grains are consumed by large grains. Average grain size increases, while the total crystalline fraction remains nearly unchanged. Meanwhile, defect recovery reduces dislocation density and microstrain, which researchers describe as improved crystal quality.
6. Measurement Principles of Different Characterization Techniques
6.1 XRD
XRD pattern contains peak position, integrated intensity and peak width.
1. XRD crystallinity: For suitable crystalline–amorphous mixed systems, an apparent crystallinity or crystallinity index can be estimated from the integrated crystalline and amorphous scattering contributions:
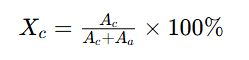
Limitation: This is an approximation and method-dependent calculation, not an absolute universal formula for all materials. Simple peak-area ratios can be misleading for multiphase materials, samples with strong preferred orientation, electrode composites, graphite or hard carbon and other partially ordered carbon materials. Results also depend on background fitting and instrument setup. Only compare data analyzed with identical workflow. Peak height cannot represent crystallinity, as preferred orientation, particle statistics and crystallite size strongly alter peak height.
2. Crystallite size from Scherrer equation:
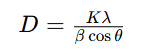
D = coherent crystallite size.
Limitation: Peak broadening also originates from microstrain, defects and instrument broadening. Use Williamson–Hall or whole pattern fitting to separate size broadening and strain broadening. ❗ Scherrer result = coherent domain size, NOT grain size.
6.2 DSC
For polymers, DSC calculates crystallinity by melting enthalpy:

ΔHm: melting enthalpy; ΔHcc: cold crystallization enthalpy; ΔHm⁰: melting enthalpy of fully crystalline reference polymer; wp: mass fraction of polymer within the sample.
Note: For neat polymers, wp=1. For composites containing inorganic fillers, carbon additives or fibers, the polymer mass fraction must be included. Calculations use absolute enthalpy values, as sign conventions for exothermic/endothermic events vary across DSC software. Limitation: DSC only quantifies total crystalline content. It cannot tell crystal size, grain morphology or coherent domain dimension.
6.3 SEM & EBSD
- SEM: observes particle morphology and grain boundaries, estimates physical grain/particle size. Note: secondary particles may consist of many primary grains, particle size ≠ grain size.
- EBSD: detects grain boundaries via crystallographic misorientation, outputs grain size distribution, texture and local misorientation. The calculated grain size relies on misorientation threshold setting.
6.4 Polymer multi-scale structure supplement
POM observes spherulites. A spherulite is a hierarchical assembly made of many crystalline lamellae. Three independent scales: nanometer lamellar thickness, micron spherulite size and bulk crystallinity.
7. Significance for Battery Electrode Materials
For anode and cathode powders (graphite, hard carbon, LFP, NCM, sodium layered oxides), multi-level microstructure widely exists: A micron secondary particle contains multiple primary particles, grains and coherent diffraction domains. SEM particle size ≠ primary particle size ≠ grain size ≠ XRD crystallite size
These structural parameters can significantly influence lithium-ion transport, particle cracking, rate capability and cycling stability, depending on the material chemistry and microstructure.
For graphite anodes, XRD calculates Lc and La (coherent stacking dimension), which should not be confused with particle size.
For carbon materials, “crystallinity” should be used cautiously. Graphitization degree, d002, Lc, La, Raman defect indicators and local ordering often provide more meaningful structural information than a simple crystalline/amorphous percentage.
8. Common Interpretation Mistakes
- Higher crystallinity = larger grains → Wrong. High nucleation density increases crystallinity but refines crystals.
- XRD crystallite size equals SEM grain size → Wrong. XRD measures coherent domains inside grains.
- Higher XRD peak intensity = higher crystallinity → Wrong. Preferred orientation greatly affects peak intensity.
- Wider XRD peaks always mean smaller grains → Wrong. Peak broadening may come from microstrain and lattice defects.
- DSC can measure grain size → Wrong. DSC only measures crystalline fraction.
- “Good crystallinity” is a quantitative conclusion → Wrong. Replace with microstrain, defect density, grain size or coherent domain size.
9. Recommended Characterization Workflow
- Judge if crystalline/amorphous fraction matters: DSC (polymer), XRD/WAXD
- Identify crystal phase and lattice parameters: XRD, Rietveld refinement
- Quantify coherent domain size and microstrain: Scherrer for preliminary estimation; Williamson–Hall / whole pattern fitting for strain-containing samples
- Observe physical morphology: SEM, TEM, POM
- Measure orientation-defined grains and texture: EBSD
Reliable structure-property relationships require combining multiple characterization methods instead of relying on one single test.
Conclusion
- Crystallinity: the fraction of crystalline phase in bulk material.
- Crystal Quality: a qualitative concept that may be described using parameters such as microstrain, defect density, mosaicity, coherent domain size and lattice disorder, depending on the material and technique.
- Grain Size: physical grain dimension defined by crystal orientation, observed via microscopy/EBSD.
- Crystallite Size: coherent diffraction domain size calculated from XRD peak broadening.
Core rule: Do not use one characterization technique to answer structural questions outside its scope. XRD, DSC, SEM, TEM and EBSD supply complementary information. Distinguishing these concepts is essential for battery and advanced material research.
FAQ
Q1: Is XRD crystallite size identical to SEM grain size?
A: No. XRD evaluates coherent diffraction domains. SEM/EBSD captures physical grains. One grain can contain multiple coherent domains when subgrain boundaries or lattice defects limit diffraction coherence.
Q2: Does higher crystallinity mean larger crystals?
A: No. High nucleation density increases crystallinity while generating finer crystals.
Q3: Can crystallinity be calculated by XRD peak height?
A: No. Calculate from separated integrated area of crystalline and amorphous scattering with fixed fitting standards.
Q4: What does Scherrer equation calculate?
A: Coherent diffraction domain size from peak broadening after instrument correction, assuming size effect dominates broadening.
Q5: Why XRD crystallite size is usually smaller than SEM grain size?
A: Internal subgrains, low-angle boundaries and lattice defect fields limit diffraction coherence, so a single physical grain may contain multiple coherent diffraction domains. Note this trend is not universally true for all samples.
Q6: How to calculate polymer crystallinity using DSC?
A: Compare melting enthalpy against fully crystalline reference value. Use Xc=(ΔHm−ΔHcc)/(wpΔHm⁰)×100%; wp=1 for neat polymers, and polymer mass fraction is required for composites. Enthalpy values are taken as absolute values.
Q7: Which technique measures grain size?
A: SEM estimates grain morphology when grain boundaries are visible. EBSD measures orientation-defined grain size and texture.
Q8: Why these concepts matter for battery materials?
A: Electrode powder has multi-scale structures. Micron particles contain smaller primary grains and coherent domains. These features can significantly influence ion transport, mechanical stability and electrochemical performance, depending on material chemistry and microstructure.
Related Products & Services
Use Canrd products and R&D services to turn battery knowledge into practical experiments.
Coin Cell Case
ProductCoin cell cases for validating materials and electrochemical concepts from the article.
Use coin cell cases in your next test →Sodium Electrolyte
CategoryElectrolytes for sodium-ion battery research, compatibility tests, and cell validation.
Shop sodium electrolyte for validation →Cell Fabrication
ServiceGet support building dry cells, assembled cells, or custom formats for R&D validation.
Request cell fabrication support →Experimental Materials
CategoryBrowse materials for follow-up experiments, benchmarking, and product development.
Browse experimental battery materials →
