

 contact@canrd.com
 +86 18928276992
Battery Cell Consistency: Capacity, DCIR & OCV Testing Guide
Two lithium-ion cells can share identical nominal capacity, similar open-circuit voltage and same outer dimensions, yet perform differently once assembled into a battery pack. One cell hits the discharge cutoff earlier, while another shows higher voltage polarization or faster temperature rise under load. Such cell-to-cell variation cuts usable pack energy, increases BMS control complexity and accelerates uneven aging. That makes lithium-ion cell consistency a core topic in cell manufacturing, module assembly and long-term battery performance assessment.
Cell consistency is far more than simple OCV matching. It covers capacity distribution, DC internal resistance (DCIR), open-circuit voltage, self-discharge behavior, initial SOC and long-term degradation trends. This post breaks down how cell mismatch impacts series/parallel packs, how engineers test consistency, and how multi-parameter screening optimizes pack integration. It also uses a CANRD small-batch full-cell test case to show how to quantify manufacturing consistency with real capacity data.
1. What Is Lithium-Ion Battery Cell Consistency?
Lithium-ion cell consistency means the similarity of electrical, electrochemical and aging properties among cells produced for the same application. Even cells made with identical raw materials and production workflows have inherent minor variations. The engineering target is not zero difference, but keeping cell-to-cell deviation within acceptable limits for your battery system.
Key Evaluation Parameters
| Parameter | Measurement | Core Impact |
|---|---|---|
| Discharge Capacity | Extractable charge under defined test conditions | Determines usable energy and capacity grading |
| DC Internal Resistance (DCIR) | Voltage shift under fixed current pulse | Influences polarization, power output and heat generation |
| Open-Circuit Voltage (OCV) | Rest terminal voltage | Auxiliary SOC estimation & preliminary voltage screening |
| OCV Decay / K-Value | Voltage drop over static storage | Identifies abnormal voltage change trends; K-value is not a direct measurement of self-discharge current |
| Initial SOC | Remaining charge relative to cell capacity | Decides initial pack balance state |
| Cycle-Life Performance | Capacity retention & resistance growth during cycling | Predicts long-term performance divergence |
| Thermal Response | Temperature change during charge/discharge | Detects uneven heating and cooling demands |
Critical note: Do not judge consistency by one single metric. Two cells with nearly equal capacity can have different DCIR. Under identical discharge current, their voltage response and heat output will diverge. For LFP cells, the relatively flat OCV–SOC curve and voltage hysteresis make voltage-only SOC estimation less reliable. OCV screening should be combined with standardized SOC setting and additional electrical measurements.
2. How Cell Inconsistency Impacts Series & Parallel Packs
Cells are connected in series, parallel or series-parallel combinations to hit target voltage, current and energy. The effect of mismatch differs drastically by topology.
2.1 Series Connection: The weakest cell limits total usable capacity
All cells in a series string carry the same current. Variations in capacity, SOC and internal resistance make individual cells evolve differently during operation.
- Discharge: A low-capacity / low-SOC cell reaches minimum voltage cutoff first. BMS must stop discharge, leaving residual energy trapped in other cells.
- Charge: One cell hits upper voltage limit before the rest of the string is fully charged.
Series mismatch can reduce pack usable energy.
2.2 Parallel Connection: Uneven current sharing
Parallel cells share the same terminal voltage but split current unequally. Differences in DCIR, SOC, capacity and tab contact resistance cause uneven current distribution, leading to gaps in current throughput, polarization, heat generation and aging speed. Newly paralleled cells with different starting voltages also produce equalization currents.
Parallel matching must focus on current sharing behavior, not only capacity or OCV screening.
Series vs Parallel Quick Comparison
| Evaluation Item | Series Connection | Parallel Connection |
|---|---|---|
| Current | Identical for every cell | Distributed across branches |
| Voltage | Sum of individual cell voltages | Shared terminal voltage |
| Capacity Mismatch | There is a limited utille string capacity | Disturbs SOC evolution & current split |
| Resistance Mismatch | Creates different voltage drop & heat | Changes branch current allocation |
| Main Design Concern | Cell voltage cutoff protection | Current sharing & thermal uniformity |
Series-parallel packs need to handle both inconsistency types at the same time.
3. Root Causes of Cell-to-Cell Variation
Consistency issues originate across the whole manufacturing workflow, not only end-of-line testing.
- Electrode manufacturing variations Slurry dispersion inconsistency, uneven coating mass loading, calendering density/porosity deviation, electrode slitting burrs. Some of these defects can be captured during electrode coating, calendering, visual inspection and inline quality checks; others only become detectable during formation or electrical testing.
- Cell assembly & electrolyte filling Electrode misalignment, separator offset, tab welding resistance variance, non-uniform electrolyte filling and poor wetting raise polarization and abnormal electrochemical response. This strongly affects manual-built R&D cells.
- Formation & aging differences Formation defines anode SEI film properties. Varied formation temperature, current, pressure and rest time change irreversible capacity loss. Post-formation aging and OCV monitoring catch abnormal voltage decay.
- Operating temperature drift Even initially well-matched cells may develop different aging characteristics if they run in different thermal zones. This highlights why pack thermal management remains mandatory.
Cell consistency is a full-process quality problem, not merely a final sorting step.
4. Standard Methods to Measure Cell Consistency
All consistency tests require fixed conditions. Changing SOC, temperature, C-rate or rest time will alter measured results.
4.1 Capacity Testing
Test under identical charge/discharge protocol, cutoff voltage, temperature and rest period. Evaluate batch consistency via value distribution plus pre-defined acceptance criteria. Unit: mAh / Ah.
4.2 DCIR Testing
Formula:
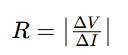
DCIR result depends on pulse duration, SOC, temperature and current magnitude. Resistance measured at one set of test conditions cannot be directly compared with data collected under different conditions. DCIR ≠ AC impedance.
4.3 OCV and K-Value Screening
K-value formula:
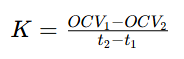
Symbol convention for this article: a positive K-value represents a drop in open-circuit voltage over time. K-value comparison is only valid under defined temperature, SOC, resting state and measurement interval. Unit: mV/day. K-value is an indicator of voltage decay trend, not a direct measurement of self-discharge current.
4.4 Cycle Aging & Resistance Growth Assessment
Matching initial specs cannot guarantee identical aging. Track capacity retention, DCIR rise, thermal response and degradation divergence through cycling.
5. CANRD Case Study: 10 R&D Full-Cell Capacity Consistency
A small batch of 10 CANRD full cells was tested for capacity variation.
| Test Parameter | Result |
|---|---|
| Sample Count | 10 full cells |
| Charge Capacity Range | 1728–1749 mAh |
| Average Charge Capacity | 1736.9 mAh |
| Charge Capacity Standard Deviation | 6.26 mAh |
| Charge Capacity CV | 0.36% |
| Discharge Capacity Range | 1529–1548 mAh |
| Average Discharge Capacity | 1537.2 mAh |
| Discharge Capacity Standard Deviation | 5.67 mAh |
| Discharge Capacity CV | 0.37% |
| Initial Coulombic Efficiency | 88.3%-88.7% |
CV (Coefficient of Variation) = (Standard Deviation / Mean) ×100% The 0.37% discharge CV indicates low capacity dispersion within this sample batch.
Key takeaway: This dataset reflects only initial capacity distribution for these 10 R&D samples. The available records do not fully disclose cell chemistry, test C-rate, equipment calibration or long-term cycling performance. Therefore, the results cannot be used to infer long-term pack consistency or general mass manufacturing capability. Always evaluate consistency from statistical distribution, not single sample readings.
6. Capacity Grading vs Cell Matching
Many engineers confuse these two processes.
| Item | Capacity Grading | Cell Matching |
|---|---|---|
| Core Goal | Classify cells by measured capacity | Select compatible cells for pack assembly |
| Main Metrics | Charge / discharge capacity | Capacity, DCIR, OCV, K-value, SOC, aging traits |
| Workflow Stage | Post formation, quality screening | Pre module / pack assembly |
| Deliverable | Capacity grade classification | Matched cell groups |
| Limitation | Cannot detect resistance or self-discharge defects | Initial matching cannot stop aging divergence |
A cell can pass capacity grading but still get rejected from matched groups due to high DCIR or abnormal K-value.
7. Practical Multi-Parameter Cell Matching Workflow
- Verify cell model, chemistry, batch traceability and specs
- Basic visual quality check: deformation, leakage, terminal damage
- Run standardized capacity grading
- Test DCIR under unified SOC, temperature and pulse settings
- OCV & K-value aging screening, flag outliers
- Normalize all qualified cells to the same initial SOC
- Group cells by project criteria; perform validation testing for high-demand applications
Acceptance thresholds vary by battery chemistry, use case and system design. There is no universal tolerance for all packs.
8. BMS Balancing Cannot Replace Cell Matching
BMS monitors cell voltage, temperature, current and SOC. The monitoring granularity depends on system architecture; current and temperature may not be measured individually for every single cell.
- Passive balancing: Bleeds excess SOC through resistors; simple but wastes energy as heat.
- Active balancing: Shifts energy between cells; lower energy loss but more complex hardware.
What balancing cannot fix
Balancing only reduces SOC imbalance. It cannot recover lost capacity, eliminate inherent DCIR mismatch or repair abnormal self-discharge. The optimal solution combines qualified incoming cells, strict multi-parameter matching, proper BMS and thermal management.
9. Troubleshooting Common Consistency Issues
| Observed Issue | Possible Causes | Recommended Check |
|---|---|---|
| Wide voltage spread during discharge | Capacity, SOC or DCIR mismatch | Capacity DCIR SOC testing under identical conditions |
| Growing voltage gap during storage | Uneven relaxation / abnormal self-discharge | OCV static test & K-value screening |
| Individual cells overheat under load | Uneven current split, high resistance or poor contact | Resistance, connection and thermal inspection |
| Pack hits voltage cutoff prematurely | Limited usable SOC window or weak series cell | Capacity test and charge-discharge profile review |
| Similar OCV but different deliverable capacity | Different real capacity; flat OCV-SOC chemistry may contribute | Standard capacity testing |
| Wider resistance spread after cycling | Uneven degradation or thermal history | Periodic DCIR and cycle aging testing |
Resistive heating: P≈I^2 * R. Higher resistance generates more heat, while ambient thermal conditions also affect cell temperature. Matching and thermal management must work together.
Important safety note: Cell inconsistency may raise electrical and thermal stress under certain operating conditions, but mismatch alone will not automatically trigger thermal runaway. Safety assessment requires cell, module and pack-level validation.
10. Build Your Cell Consistency Test Program
Design the test matrix based on your target application:
- High-power pulse applications: Prioritize DCIR and thermal response
- Long-duration energy storage: Focus on storage aging, capacity retention and voltage drift
CANRD reference test examples:
| Test Category | Test Condition | Evaluation Purpose |
|---|---|---|
| DC Resistance (DCR) | 25°C, 10-second pulse, with SOC points and test current defined according to the cell specifications | Compare pulse resistance across defined SOC levels |
| Cycle Life | 25°C;1C charge/1C discharge; 80% capacity retention endpoint | Evaluate cycling degradation |
| High-Temp Cycling | 45°C;1C/1C;80% capacity retention endpoint | Aging performance at elevated temperature |
| Storage Test | 25°C, 28 days | Characterize changes during static storage |
Generate batch reports including mean, standard deviation, CV, min/max and outlier IDs. For long-term reliability, compare parameter distributions pre-cycle and post-cycle.
Conclusion
Lithium-ion cell consistency is a multi-dimensional quality metric that decides pack energy utilization, power capability, thermal behavior and service life. For series packs, capacity and SOC mismatch can shrink the usable operating window. For parallel groups, parameter differences cause uneven current sharing and hotspots. Reliable assessment needs combined capacity testing, DCIR measurement, OCV/K-value screening and statistical analysis — voltage check alone is insufficient. CANRD’s small-batch full-cell data demonstrates how to quantify capacity variance, while reminding designers resistance, thermal and aging tests are essential before pack deployment. The target is not only selecting cells with matching initial readings, but building a full battery system where manufacturing quality, cell matching, BMS monitoring and thermal control jointly sustain stable performance.
FAQ
Q1. What is the most important parameter for lithium-ion battery cell matching?
No single parameter dominates. Select metrics including capacity, DCIR, SOC and aging indicators based on pack application and operating requirements.
Q2. Can two lithium-ion cells with identical voltage have different capacities?
Yes. OCV cannot directly represent usable capacity. Cells with matching OCV can differ in real capacity, resistance and aging speed.
Q3. What is acceptable capacity variation for cell matching?
No universal percentage. Acceptable deviation depends on battery chemistry, application and system specs. Judge variation by project-specific test data.
Q4. Does low K-value always equal low self-discharge?
No. K-value measures voltage change over time, affected by temperature, SOC, relaxation and cell chemistry. It is not a direct reading of self-discharge current.
Q5. Why do well-matched cells turn inconsistent after cycling?
Cells may experience different local temperature, current stress and degradation rates. Even initially matched cells gradually diverge in capacity and resistance after repeated cycles.
Q6. Can BMS fix capacity and resistance mismatch?
No. Balancing only mitigates SOC imbalance in series groups. It cannot recover lost capacity or eliminate intrinsic resistance differences. Cell matching and thermal management remain necessary.
Verwandte Produkte und Services
Nutzen Sie Canrd-Produkte und R&D-Services, um Batteriewissen in praktische Experimente umzusetzen.
Coin-Cell-Gehäuse
ProduktCoin-Cell-Gehäuse zur Validierung von Materialien und elektrochemischen Konzepten aus dem Artikel.
Coin-Cell-Gehäuse im nächsten Test nutzen →Natrium-Elektrolyt
KategorieElektrolyte für Natrium-Ionen-Batterieforschung, Kompatibilitätstests und Zellvalidierung.
Natrium-Elektrolyt für Validierung kaufen →Zellfertigung
ServiceUnterstützung beim Bau von Trockenzellen, montierten Zellen oder kundenspezifischen Formaten.
Zellfertigungsunterstützung anfragen →Experimentelle Materialien
KategorieMaterialien für Folgeexperimente, Benchmarking und Produktentwicklung ansehen.
Experimentelle Batteriematerialien ansehen →
