contact@canrd.com
 +86 18928276992
 Home/Resources/Knowledge/Cell Fabrication/How to Set Lithium-Ion Battery Formation Parameters: Current, Temperature, Pressure, SOC and Meta
How to Set Lithium-Ion Battery Formation Parameters: Current, Temperature, Pressure, SOC and Meta
Canrd July 31, 2026 454
1. Introduction: Solve Your Formation Parameter Pain Points
There is no universal formation current, temperature, pressure or cutoff voltage applicable to all lithium-ion cells. Valid process windows rely heavily on cathode/anode chemistry, electrolyte formula, cell format, electrolyte wetting status, and production KPIs (cycle life, batch consistency, production takt time).
By reading this guide, battery process engineers, lab R&D technicians and production line supervisors will master three core capabilities:
- Diagnose which formation parameter causes abnormal cell performance
- Understand how each condition modulates interfacial electron density and reactant transport to alter SEI quality
- Use lab dQ/dV testing and single-factor DOE to build customized formation windows
2. Quick Reference Table: Which Parameter to Troubleshoot First
| Observed Cell Abnormality | Priority Parameter to Inspect First | Supporting Validation Data Needed |
|---|---|---|
| Severe polarization, shifted reaction peaks on charge curves | Formation current (Stage 1) | Full-cell voltage traces, dQ/dV plots, temperature rise log |
| Large batch deviation on ACIR, DCIR or post-formation thickness | Formation pressure fixture temperature uniformity | Pressure sensor logs, thermocouple distribution data, cell thickness statistics |
| Slow stabilization after formation, persistent high impedance | Formation temperature electrolyte wetting duration | Electrolyte viscosity-temperature curve, pre-aging records |
| Excessive pouch swelling / large gas pocket volume | Formation cutoff voltage, maximum temperature, electrolyte moisture test results | Gas volume measurement, GC-MS gas composition data |
| Wrinkled electrodes, inconsistent post-calendering thickness | Target formation SOC, clamping pressure | Post-formation thickness single-factor analysis charts |
| Coin cell dQ/dV peak shifts drastically with charging rate | Low-current formation current (0.02C / 0.03C / 0.05C comparison) | Differential capacity curves at multiple low C-rates |
3. Brief Overview: How Parameters Interact With SEI
All adjustable formation parameters modify two core interfacial variables that govern SEI layer quality:
- Electron density at graphite particle reaction sites
- Interfacial availability of solvated lithium ions and film-forming additives
Adjustments to current, pressure, temperature, electrolyte or cutoff voltage will shift the balance between one-electron and two-electron reduction reactions, altering inorganic/organic SEI component ratio.
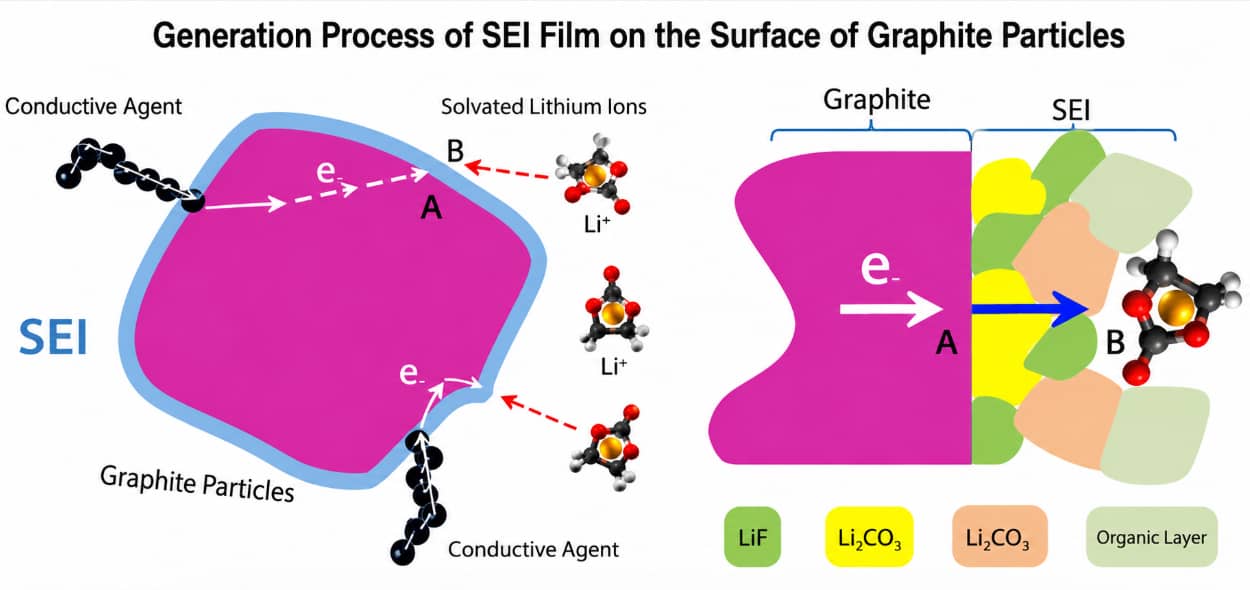
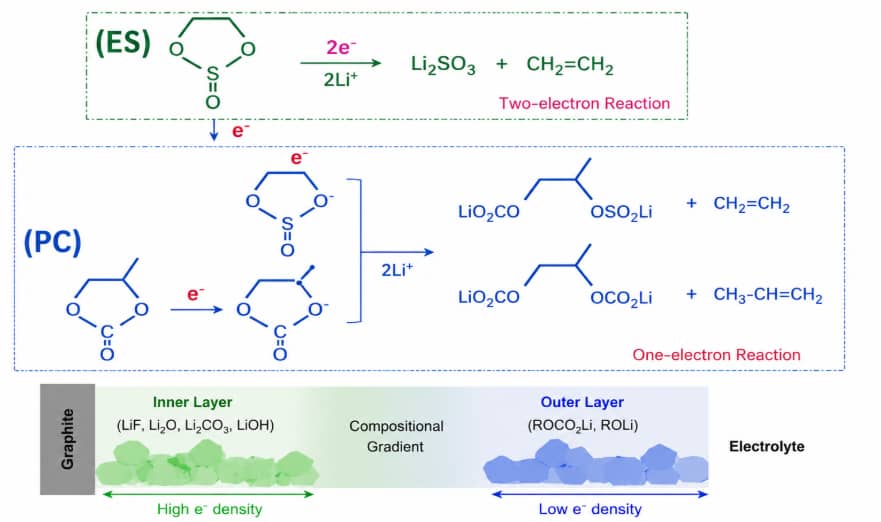
The slide reaction chart differentiates two-electron pathways (generate inorganic lithium salts) and one-electron pathways (generate organolithium), which are the core mechanism linking parameter settings to final SEI composition.
4. How Formation Current Changes Polarization & SEI Uniformity
Core Mechanism
Formation current directly controls electron density at graphite Point A (SEI nucleation sites). The larger formation current I is, the more electrons reach graphite surface per unit time, raising polarization and shifting film-forming peaks to higher voltage on dQ/dV curves. Different current densities create SEI with distinct microstructures.
Stage 1 (SEI Forming Charge) vs Stage 2 (Post-SEI Charging) Distinction
- Stage 1 priority: Minimize polarization to achieve full, uniform graphite passivation High Stage 1 current cuts takt time but triggers heavy polarization, incomplete additive decomposition and patchy organic-rich SEI.
- Stage 2 flexibility: Higher charging rates bring minor negative impacts After continuous insulating SEI forms in Stage 1, electrolyte side reactions are suppressed, so faster charging is acceptable for SOC adjustment.
Key Engineering Takeaway
A higher formation current shortens process time but increases polarization and shifts film-forming potential. Engineers must evaluate dQ/dV shape, cell temperature rise, gas yield and cycle retention comprehensively rather than only prioritizing production speed.
5. How Formation Pressure Controls Interfacial Current Distribution
Core Mechanism
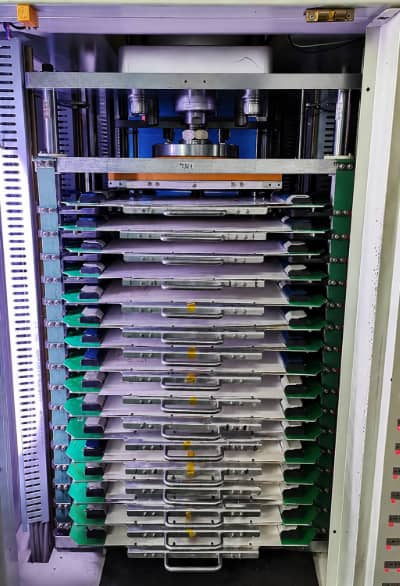
Uneven electrode stacking creates uneven cathode-anode gaps. Narrow contact spots (Point a) carry higher local current density while wide gaps receive fewer electrons, forming non-uniform patchy SEI. Applied uniform pressure flattens electrode sheets, eliminates gap differences and homogenizes interfacial current distribution.
Balanced Risk Explanation
- Insufficient pressure: Retained electrode bumps create local high-current hotspots and inconsistent SEI thickness
- Excessive pressure: Potential risk of active material detachment from current collectors, must be verified by coating adhesion and cycle tests
- Reference note: 0.6–1.0 MPa pressure window is only valid for the pouch cell group in this training dataset, not universal standard for all cell sizes or coating thicknesses.
6. How Temperature Regulates Electrolyte Ion Transport
Core Mechanism
With identical electrolyte formulation:
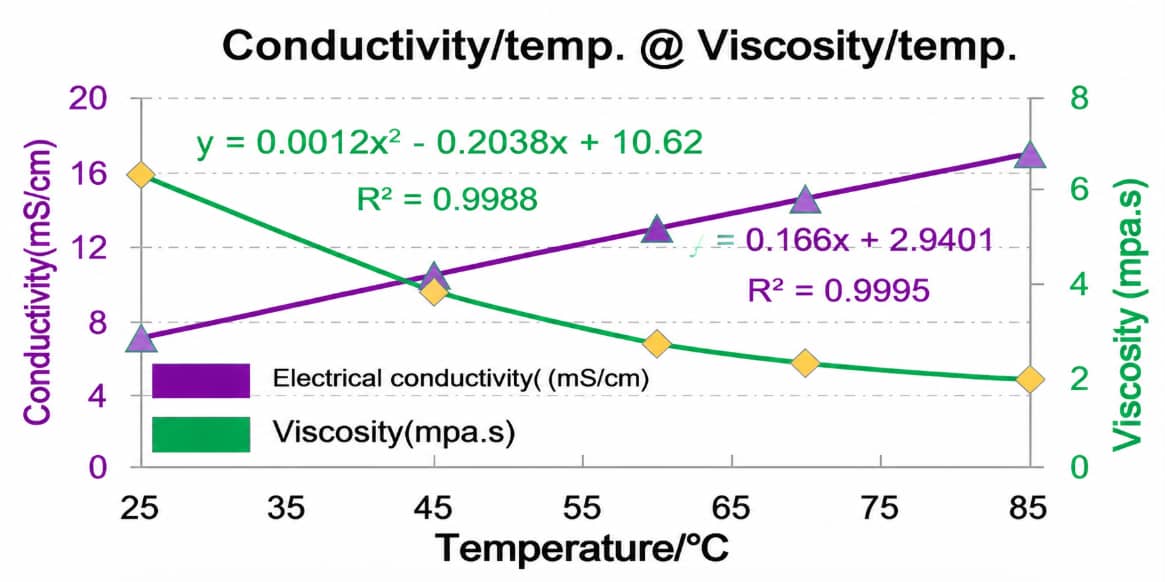
- Temperature rise reduces electrolyte viscosity, lowering mass transfer resistance of solvated Li⁺ and film-forming additives
- Higher ionic conductivity reduces overall cell polarization
- More reactants reach SEI reaction Point B within fixed formation duration to accelerate passivation
Training Dataset Boundary Clarification
The single-factor thickness test recorded unfavorable thickness results at 90°C, hence the suggested 70–85°C working window. This trend only applies to the specific electrolyte, separator and stack design used in training. There is no industry-wide rule that 90°C will permanently damage cells; all temperature limits need single-factor DOE validation for your own formulation.
7. Why Electrolyte Formulation Rewrites Your Formation Window
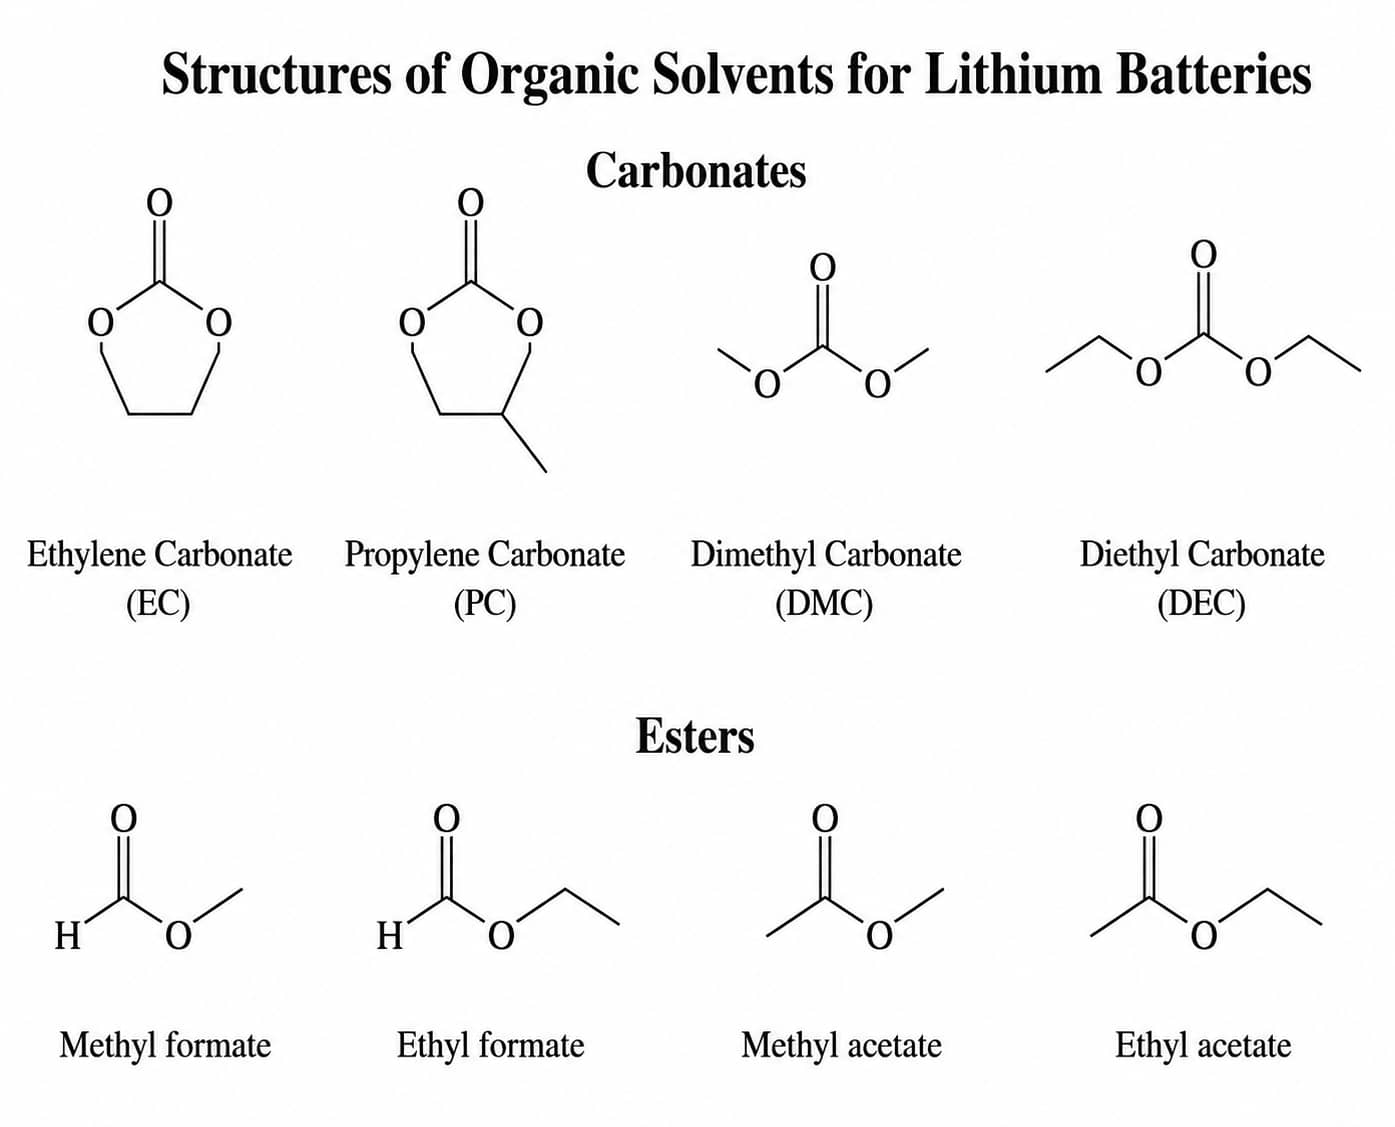
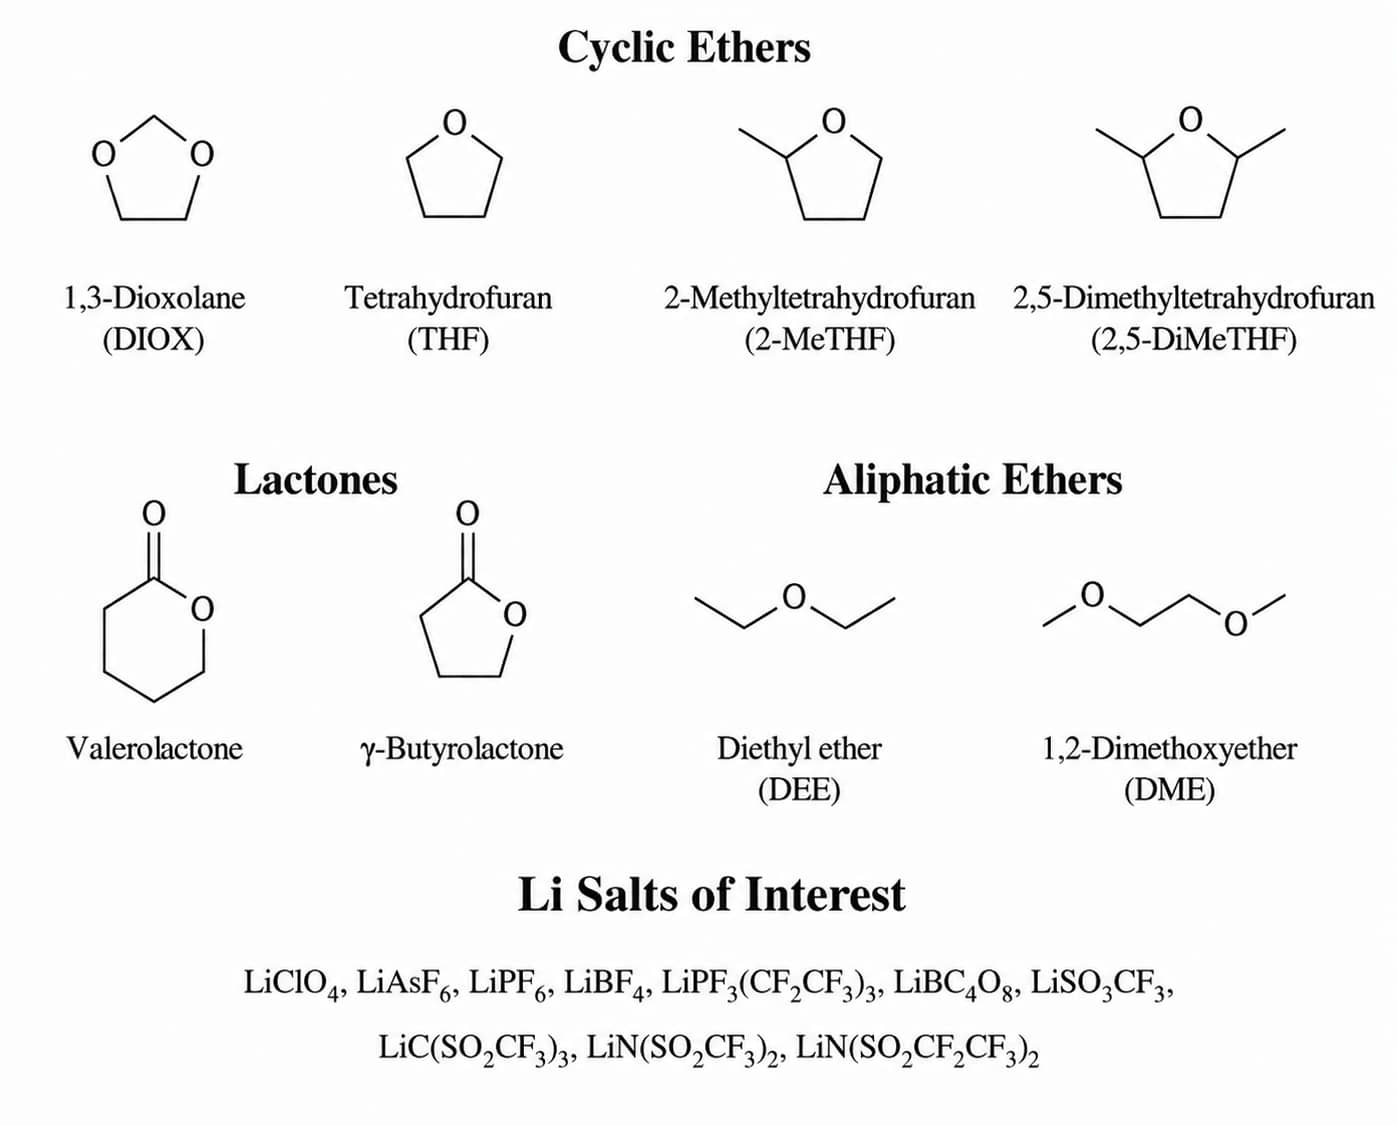
Core Takeaway
All solvents, lithium salts and functional additives have unique reduction potentials and reaction pathways. A current/temperature/cutoff voltage window optimized for one electrolyte blend cannot be directly copied to another formula. Minor additive adjustments (VC, FEC, ES) shift the voltage window where SEI nucleation occurs.
Additional supporting chart for electrolyte electrochemical windows:
8. How to Select Full-Cell Formation Cutoff Voltage
Critical Terminology Correction
- Full-cell formation cutoff voltage: Terminal voltage of complete pouch cells (mass production usage)
- Electrode potential: Half-cell potential vs Li/Li⁺ (lab coin cell testing only)
System-Dependent Window Rule
Every cathode-anode electrolyte combination has a unique electrochemical stability window. The 3.0–3.5V film-forming range observed in Part 1 gas tests only applies to that specific LCO/graphite system, and cannot be generalized to all graphite-based cells.
Selection Logic
Cutoff voltage must exceed the full potential range of additive reduction:
- Too low: Incomplete graphite passivation leads to continuous electrolyte side reactions during cycling
- Too high: Over-reduction of linear carbonates generates excessive irreversible lithium loss and pouch swelling
9. Two-Stage Pouch Cell Formation Process Explained
Official Training Process Sequence
Hot press fixture loading → Stage 1 SEI-Forming Charge → Stage 2 Continued Charging → Fixture unload
Stage Functional Definition
-
Stage 1: SEI-Forming ChargeCore objective: Complete uniform graphite passivation under low polarization; determines initial coulombic efficiency and long-term cycle life. Training recommended Stage 1 rate: 0.5~1.0CSingle-factor end voltage test chart for Stage 2 current reference:End Voltage Single-Factor Analysis (0.2C/0.5C/1.0C/2.0C Groups)
-
Stage 2: Continued Charging & Cell-State AdjustmentCore objective: Charge to target SOC, stabilize OCV and lock post-hot-press electrode thickness. Training recommended Stage 2 rate:1.0~2.0CDegassing, pouch piercing and heat sealing are independent downstream manufacturing steps after formation, not functions of Stage 2 charging.
10. Reference Parameter Ranges From Internal Training Pouch Cell Case
Important Precondition: The following numerical windows are starting reference values from the training material’s specific pouch cell test group, NOT universal global standards. Adjustments are mandatory based on electrode loading, electrolyte injection volume, stack design and target application.
Temperature Single-Factor Verification Chart
| Formation Step | Reference C-Range | Purpose Context |
|---|---|---|
| Stage 1 SEI Charge | 0.5-1.0C | Balance SEI uniformity and production takt |
| Stage 2 Adjustment Charge | 1.0-2.0C | Fast SOC ramp after SEI passivation |
| Formation Temperature | 70-85°C | Optimized ion transport in training electrolyte |
Pressure Single-Factor Verification Chart
Hot Press Pressure vs Post-Formation Thickness Chart (0.75~1.0MPa)
| Hot Press Pressure | 0.6~1.0 MPa | Homogenize full electrode interfacial current |
SOC Single-Factor Verification Chart
Formation SOC vs Post-Formation Thickness Chart (0.4~0.93 SOC)
| Target Formation SOC | 66–83% | Reduce post-press thickness & eliminate electrode wrinkles |
11. Coin Cell vs Pouch Cell: Core Parameter Differences
| Comparison Dimension | Lab Coin Cell Formation | Mass-Production Pouch Cell Formation |
|---|---|---|
| Primary Goal | Characterize intrinsic material reactions with minimal polarization interference | Balance SEI quality, batch consistency & production throughput |
| Pressure Control | Fixed rigid double gasket spring plate structure, no adjustable external pressure | Tunable hot-press fixture (0.6–1.0MPa training reference) |
| Standard Temperature | Ambient room temperature; optional 45℃ for specific lab tests | Heated fixture fixed at 70–85℃ training reference |
| Formation Current | Ultra-low 0.02C~0.03C to resolve faint film-forming reaction peaks | Two-stage medium-high C-rates for mass production efficiency |
| Parameter Validation Tools | dQ/dV differential capacity curve analysis | Combined test of thickness, ACIR, pouch swelling & cycle retention |
12. Case Study: Calibrate Formation Current & Cutoff Voltage via dQ/dV Curves
Test Protocol & Observed Results
- 0.02C CC charge: Film-forming peak ~2.8V, cutoff potential 2.92V, negligible polarization distortion
- 0.03C CC charge: Identical 2.8V reaction peak, cutoff potential 2.94V, matching film-forming pathway with 0.02C
- 0.05C CC charge: Peak shifts right to ~2.9V, cutoff potential rises to 3.16V, severe polarization distorts SEI reaction
Experiment Conclusion
0.03C is the optimal coin cell formation rate balancing testing cycle length and undistorted reaction signals. A unified full-cell cutoff voltage of 3.5V is selected to fully cover all additive reduction potentials observed on dQ/dV plots. Unsupported blanket rule "cutoff voltage 0.2~0.3V above reaction peak" is removed as no data supports this claim in training slides.
13. Formation Troubleshooting Framework (Phenomenon → Evidence → Validation Steps)
Abnormality 1: High cell ACIR / DCIR after formations
- Phenomenon: Batch average impedance exceeds specification with large cell-to-cell scatter
- Required Supporting Evidence: Electrode thickness logs, fixture pressure/temperature distribution, electrolyte moisture test, dQ/dV peak position
- Validation Steps:
- Run DOE pressure test covering 0.7–0.9MPa training reference range
- Reduce Stage 1 current to 0.5~0.8C to lower interfacial polarization during SEI growth
- Adjust formation temperature to balanced 75–80°C window for improved ion transport
Abnormality 2: Excessive pouch swelling / large gas pockets
- Phenomenon: Post-formation airbag volume exceeds factory control limits
- Required Supporting Evidence: Max formation temperature records, full-cell cutoff voltage, electrolyte water content, GC-MS gas composition data
- Validation Steps:
- Cap formation temperature within training 70–85°C reference range
- Tune cutoff voltage to avoid over-reduction of linear carbonate solvents
- Strengthen electrolyte dehydration and injection workshop humidity management
Abnormality 3: Low initial coulombic efficiency (ICE)
- Phenomenon: First discharge / first charge capacity ratio falls below standard threshold
- Required Supporting Evidence: Full formation temperature trace, cutoff voltage setting, completeness of dQ/dV film-forming peak
- Validation Steps:
- Limit peak formation temperature to cut irreversible solvent side reactions
- Add constant voltage hold phase after reaching calibrated cutoff potential to finish graphite passivation
Abnormality 4: Fast capacity decay during cycling
- Phenomenon: Cells lose significant capacity within designed cycle target
- Required Supporting Evidence: Complete formation parameter records, post-formation thickness statistics, dQ/dV peak sharpness
- Validation Steps:
- Lock Stage 1 current to low-polarization 0.5~0.8C window
- Maintain target SOC between 70–80% to ensure full graphite surface coverage
- Verify fixture pressure evenly eliminates electrode contact gaps
14. FAQ
Q1: Why cannot ultra-high Stage 1 current be used to cut formation production time?
A1: Elevated Stage 1 current increases graphite interfacial electron density and polarization, shifting film-forming peaks to higher voltage and creating discontinuous organolithium-rich SEI with high impedance and short cycle life. High charging rates are only acceptable for Stage 2 after complete graphite passivation.
Q2: What balanced formation temperature should I start DOE testing with?
A2: The training pouch cell dataset recommends 75–80°C as the balanced starting DOE point. The 90°C test group delivered unfavorable thickness metrics, while temperatures below 70°C slow ion transport and risk incomplete SEI. All temperature boundaries must be re-validated with your unique electrolyte and separator combination.
Q3: How do I calibrate cutoff voltage for a new electrolyte additive formula?
A3: Fabricate corresponding coin cell samples, run low 0.03C constant current charging to generate dQ/dV curves, locate the first distinct additive decomposition peak, and set formation cutoff voltage above this potential to fully complete passivation reactions.
Q4: How does hot-press pressure improve SEI uniformity?
A4: Uniform applied pressure flattens electrode surfaces and eliminates narrow high-current gaps between cathode and anode, delivering consistent electron flux across the whole electrode area to avoid patchy, uneven SEI film growth on graphite particles.
Q5: Why do wrinkled pouch cells require higher target formation SOC?
A5: Higher formation SOC combined with uniform hot-press pressure compresses stacked electrode layers, eliminates internal interlayer gaps and surface wrinkles, and stabilizes consistent post-formation thickness across the entire cell batch.
15. Conclusion
Lithium-ion formation parameters control interfacial electron density and reactant supply, which determine graphite SEI uniformity and long-term electrochemical stability.
All C-rate, temperature, pressure and SOC numerical ranges quoted are reference starting values extracted from internal pouch cell training slides, not universal industry standards. Battery engineers must carry out single-factor DOE and coin cell dQ/dV screening to develop customized formation windows matching their cathode, anode, electrolyte and cell format.
Previous
Lithium-Ion Battery ...Related Products & Services
Use Canrd products and R&D services to turn battery knowledge into practical experiments.
Coin Cell Case
ProductCoin cell cases for validating materials and electrochemical concepts from the article.
Use coin cell cases in your next test →Sodium Electrolyte
CategoryElectrolytes for sodium-ion battery research, compatibility tests, and cell validation.
Shop sodium electrolyte for validation →Cell Fabrication
ServiceGet support building dry cells, assembled cells, or custom formats for R&D validation.
Request cell fabrication support →Experimental Materials
CategoryBrowse materials for follow-up experiments, benchmarking, and product development.
Browse experimental battery materials →