

 contact@canrd.com
 +86 18928276992
 TEM Analysis Guide: How to Read HRTEM FFT & Index SAED Patterns
Transmission Electron Microscopy (TEM) is a core nanoscale characterization technique for battery materials, catalysts, alloys and ceramics. Unlike bulk-averaging methods such as XRD, TEM provides highly localized structural information, while HRTEM can further resolve lattice fringes and atomic-scale structural features under suitable imaging conditions. Combined with HRTEM FFT analysis, lattice spacing calibration, crystal plane indexing, and SAED pattern interpretation, researchers can identify candidate local phases, measure lattice spacing, analyze orientation relationships, and evaluate local lattice distortion. This article provides a standardized, error-avoiding TEM analysis workflow based on DigitalMicrograph (DM) and crystallographic PDF databases.
1. Core Functions of TEM, HRTEM, FFT & SAED
To avoid analysis confusion, it is critical to distinguish the application scenarios of four key TEM technologies:
Conventional TEM
Focuses on nanoscale morphology characterization, including particle shape, grain boundaries, dislocations, interfaces, and structural contrast changes.
HRTEM (High-Resolution TEM)
Resolves atomic-scale periodic lattice fringes. Important: HRTEM contrast is phase-contrast information rather than a direct map of atomic positions. Apparent lattice contrast depends on specimen thickness, defocus, aberrations and crystal orientation, so structural interpretation should not rely on brightness alone. It supports quantitative analysis of local lattice spacing, crystal orientation, interface coherence, and micro defects that bulk XRD cannot capture.
HRTEM FFT
A mathematical transformation that converts real-space lattice fringes into reciprocal-space diffraction spots. For the reciprocal-space convention commonly used in TEM diffraction, g=1/d (g = reciprocal lattice vector in nm⁻¹, d = interplanar spacing). FFT spot positions are highly useful for periodicity and orientation analysis, but FFT spot intensities should not be interpreted as equivalent to quantitative diffraction intensities because HRTEM image contrast is affected by the contrast-transfer function.
SAED (Selected Area Electron Diffraction)
SAED is a directly acquired electron-diffraction pattern from a selected region of the specimen. It provides information on local crystal structure, phase characteristics, zone-axis orientation and preferred orientation. SAED spot intensity is also influenced by dynamical diffraction and specimen thickness, so it should not be directly used as a quantitative phase-fraction indicator.
2. Pre-Analysis: Accurate TEM Image Calibration
Calibration is the foundation of all quantitative TEM analysis. Wrong scale parameters will lead to incorrect lattice spacing, FFT data, and phase matching results.
Raw DM3/DM4 Files (Recommended)
Original microscope files usually retain native metadata and calibration information, making them preferable for quantitative analysis.
Exported TIF Images (Compensatory Calibration)
If only TIF files are available, restore calibration via the built-in scale bar in DigitalMicrograph:
- Use the Line Tool to fit the original image scale bar precisely;
- Go to Analysis → Calibration, input the standard scale length and unit;
- Calculate pixel size: Pixel Size = Standard Length / Pixel Count.
Key Warning: Stretched/compressed TIF images are invalid for quantitative analysis. Always prioritize raw DM files.
3. HRTEM FFT Analysis & Lattice Spacing Calculation
This is the most commonly used workflow for crystal plane identification in material research.
Step 1: Select Qualified ROI
Choose regions with clear lattice fringes, uniform orientation, high signal-to-noise ratio, and no multi-grain overlap. A square ROI is often convenient because it provides similar reciprocal-space sampling in both directions and simplifies visual interpretation, although FFT mathematically does not require a square ROI.
Step 2: Generate FFT Pattern
Run Process → FFT to obtain symmetric reciprocal diffraction spots. The center spot represents g=0, and peripheral spots correspond to different crystal lattice periodicities.
Step 3: Calculate Accurate Lattice Spacing
Core calculation rule after reciprocal-space calibration: d=1/g
For centrosymmetric double-spot measurement (error-reduction method):
- Measure the total reciprocal-space distance between two opposite diffraction spots (Δg=2g);
- Calculate single-side vector: g=Δg/2;
- Derive true interplanar spacing: d=1/g.
Common Mistake: The factor of two applies to the reciprocal-space distance, not directly to the final d-spacing.
4. Crystal Plane (hkl) Indexing & Phase Verification
Never confirm a phase with only one lattice spacing. A single d-spacing is usually non-unique because different phases may contain reflections with similar interplanar spacings.
Standard Indexing Workflow
- Convert measured nm lattice spacing to Year (1 nm = 10 Å) to match PDF card standards;
- Use Jade/HighScore software to screen sample chemical elements and filter candidate phases;
- Match multiple d-spacings and verify interplanar angles and crystallographic symmetry;
- Cross-check with EDS/EELS elemental data and XRD bulk phase results for final confirmation.
5. Interplanar Angle Measurement via FFT & IFFT
Crystal plane angles are key evidence to distinguish similar crystal structures, with two reliable test methods:
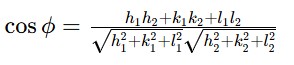
Method 1: Direct FFT Vector Angle Measurement (High Precision)
Measure the angle between two reciprocal vectors in the FFT pattern. For cubic crystals, verify with the theoretical formula:
Method 2: IFFT Visualization Measurement
- Select two groups of FFT diffraction spots and apply mask processing;
- Run Inverse FFT (IFFT) to separate two sets of lattice fringes;
- Measure the angle of the two lattices relative to the X-axis and calculate the interplanar angle difference.
Limitation: IFFT is filtered reconstructed data, not raw experimental results. Do not judge defects/strain solely by IFFT images.
6. SAED Pattern Calibration & Indexing
SAED complements HRTEM local analysis and verifies overall crystal structure and grain characteristics of the test region.
Basic SAED Principle
Core diffraction formula: Rd=Lλ (L = camera length, λ = electron wavelength). The room is constant K=Lλ, so d=K/R.
Step 1: Precise SAED Center Calibration
Center deviation causes systematic errors. Use centrosymmetric spot pairs or multi-point fitting of diffraction rings to confirm the beam center.
Step 2: Single-Crystal SAED Indexing
- Measure 2 independent reciprocal vectors and corresponding d-spacings/angles;
- Verify zone-axis relationship: hu kv lw=0;
- Ensure all indexed spots conform to unified crystal symmetry.
Step 3: Polycrystalline SAED Ring Indexing
Measure several well-defined positions around each ring, or preferably fit the full diffraction ring when software allows, to obtain a more reliable average radius.
- Convert radius to d-spacing and match multiple PDF card parameters;
- Confirm phase via ring radius ratio and chemical composition.
7. FFT vs. SAED: Core Differences
HRTEM FFT is mathematically calculated from local real-space image data, whereas SAED is directly acquired through electron diffraction from a selected specimen region. They probe different spatial scales and should be treated as complementary rather than ranked by “credibility.”
8. Most Common TEM Analysis Mistakes
- Using screenshots/resized images for quantitative calibration;
- Identifying crystal phase with only one single d-spacing;
- Misapplying the factor of two directly to d-spacing values;
- Treating IFFT reconstructed images as original experimental evidence;
- Extrapolating bulk material properties from a single localized HRTEM region.
9. Standard Publication-Ready TEM Workflow
Rhythms → morphology in there → thickness you crystal → psychoanalysis → psychoanalysis Specific → (d) Oil → Easy Eagle-Man → Eastern Footwear → ROOE DO IT
Conclusion
Rigorous TEM analysis relies on the organic combination of HRTEM real-space imaging, FFT reciprocal calculation, and SAED physical diffraction verification. Lattice spacing and crystal plane indexing cannot rely on single data matching. For battery and advanced material research, multi-method cross-validation improves the reliability of local phase identification, lattice-distortion analysis and interface-defect interpretation. TEM enables localized structural characterization of crystal phases, lattice distortion, and nanoscale defects, but its highly localized field of view means bulk conclusions should be supported by techniques such as XRD and compositional analysis.
FAQ
Q1: What is the essential difference between FFT and SAED?
A1: HRTEM FFT is mathematically calculated from local real-space image data, whereas SAED is directly acquired through electron diffraction from a selected specimen region. They probe different spatial scales and should be treated as complementary rather than ranked by “credibility.”
Q2: How to avoid FFT lattice spacing calculation errors?
A2: Use centrosymmetric double-spot measurement, confirm image calibration validity, and remember the factor of two applies to reciprocal-space distance instead of directly to d-spacing.
Q3: Can TEM identify a crystal phase?
A3: Yes, local phase identification can be reliable when multiple d-spacings, interplanar angles, diffraction symmetry, zone-axis relationships and composition are mutually consistent. However, because TEM samples a very small region, bulk phase composition should normally be cross-validated with techniques such as XRD.
Q4: What is the purpose of IFFT?
A4: It isolates selected spatial-frequency components, making a particular lattice-fringe family easier to visualize. IFFT output is filtered reconstruction and cannot be used as independent defect characterization evidence.
Related Products & Services
Use Canrd products and R&D services to turn battery knowledge into practical experiments.
Coin Cell Case
ProductCoin cell cases for validating materials and electrochemical concepts from the article.
Use coin cell cases in your next test →Sodium Electrolyte
CategoryElectrolytes for sodium-ion battery research, compatibility tests, and cell validation.
Shop sodium electrolyte for validation →Cell Fabrication
ServiceGet support building dry cells, assembled cells, or custom formats for R&D validation.
Request cell fabrication support →Experimental Materials
CategoryBrowse materials for follow-up experiments, benchmarking, and product development.
Browse experimental battery materials →
