

 contact@canrd.com
 +86 18928276992
Battery dQ/dV Analysis Guide: How to Interpret Formation Peaks
For lithium-ion battery R&D and formulation engineers, dQ/dV (differential capacity) analysis unlocks hidden electrochemical signals during cell formation. Small fingerprint peaks on the first-charge dQ/dV curve reveal early SEI formation, electrolyte additive reduction and electrode surface reactions that cannot be seen on standard voltage-capacity plots.
A common trap: a peak on the dQ/dV curve does not directly equal a confirmed chemical reaction. For high-nickel NMC/graphite full cells, low-voltage peaks near 0.95 V, 1.37 V, 1.9 V and 2.5 V cannot be assigned to specific additives by voltage alone. Reliable interpretation depends on electrode potentials, electrolyte composition, test history and data processing.
This practical guide explains core principles, how to validate peak authenticity, reaction hypothesis building, and controlled experiments to get defensible conclusions.
1. What Is dQ/dV Analysis?
dQ/dV, or differential capacity, describes charge passed over a narrow voltage interval. For constant-current charging:
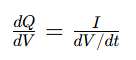
Flat regions on your charge curve create large dQ/dV peaks: substantial charge flows while voltage barely shifts.
A dQ/dV peak may represent:
- Phase transitions
- Lithium intercalation
- Interfacial side reactions like additive reduction and SEI growth
Important distinction: Incremental Capacity Analysis (ICA) plots dQ/dV vs voltage. DVA (Differential Voltage Analysis) plots dV/dQ against capacity. They deliver related information but cannot be swapped.
2. Validate Peak Credibility Before Electrochemical Interpretation
Differentiation amplifies weak reaction signals, but it also magnifies measurement noise and processing artifacts. The discrete calculation formula:
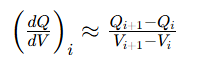
Direct differentiation becomes unstable when adjacent voltage increments approach the instrument’s resolution or noise level. Adequate raw sampling is beneficial, but repeated or quantized voltage readings require appropriate processing. Always run these checks before discussing chemistry:
| Check Item | Why It Matters |
|---|---|
| Tester current range & accuracy | Relative current uncertainty may increase at low applied currents, depending on the selected range, offset, and tester specifications. |
| Voltage calibration & resolution | Tiny voltage errors heavily distort derivative peaks |
| Logging interval | Sparse raw data cannot be fixed by interpolation |
| Smoothing & differentiation settings | Processing can create, shift or erase small peaks |
| Parallel cell repeatability | Separate real electrochemical behavior from tester channel noise |
ICA method guidance emphasizes consistent testing, adequate voltage sampling, and checking that processing does not distort the original features. Its recommended settings are useful starting points, rather than universal prescriptions for every formation experiment.
Repeatability is not enough. Even stable, recurring peaks can come from fixed tester program transitions or identical smoothing algorithms. Valid electrochemical features must survive reasonable changes to data processing.
3. Full-Cell Voltage ≠ Single Electrode Potential
The full cell voltage is only the difference between cathode and anode potentials. If E_positive and E_negative refer to equilibrium potentials, polarization and ohmic contributions must be added to the formula. If they refer to measured working electrode potentials, polarization is already included and should not be double counted.

During early charging, the falling graphite potential may dominate the rise in full-cell voltage, but this interpretation should be checked for the specific cell and its initial electrode states.
For illustration only, assume that the cathode potential remains at 3.50 V vs Li/Li⁺ and neglect polarization and ohmic contributions. The estimated anode potential is then calculated as 3.50 V minus the full-cell voltage. These assumptions have not been verified for the cell shown.
Reference Conversion Table (Estimated Only, Not Absolute Values)
| Full-Cell Voltage | Estimated Anode Potential vs Li/Li⁺ |
|---|---|
| 0.95V | 2.55V |
| 1.37V | 2.13V |
| 1.90V | 1.60V |
| 2.50V | 1.00V |
This mapping is only for directional reference. A 0.15 V shift in cathode potential directly changes this anode estimation. For precise results, use three-electrode cells.
4. Interpretation of Four Low-Voltage First-Charge Features
These peaks are observed on the annotated 0.02C formation dQ/dV curve. Below are investigation directions, not confirmed chemical assignments.
~2.5 V Full-Cell Peak
The feature near 2.5 V is more prominent than the earlier shoulders in the supplied plot. Electrolyte reduction and negative-electrode passivation are plausible hypotheses. VC or FEC may contribute if present, but their involvement cannot be established from full-cell voltage alone. Overlapping solvent reactions may contribute.
~1.9 V Full-Cell Peak
The feature near 1.9 V remains unassigned. Candidate contributors include formulation-dependent electrolyte reactions, electrode surface processes, and impurity-related reactions. Neither PS nor LiPO₂F₂ should be identified without formulation controls. Low moisture concentration alone does not exclude a detectable water-related contribution. Copper and carbon substrate studies show surface conditions and moisture levels can alter high-potential reduction features; however, those literature results cannot directly confirm the origin of this observed peak.
~1.37 V Full-Cell Peak
This small shoulder peak has multiple potential sources:
- Reduction of copper foil native oxide layer
- Electrochemical reactions of graphite surface functional groups
- Reactions involving electrolyte components, if supported by controlled formulation comparisons.
No single assignment is possible from full-cell voltage.
~0.95 V Full-Cell Peak
This earliest, weakest feature carries the highest artifact risk. Check for voltage stabilization delays, instrument range switching and smoothing boundary effects. Only after repeated stable detection should researchers explore high-potential interfacial reactions.
5. Are These Graphite Staging Peaks?
Graphite staging describes changes between lithium–graphite intercalation phases. These processes occur at relatively low graphite potentials vs Li/Li⁺.
If electrode-potential measurements confirm that graphite remains above its main intercalation region, conventional graphite staging is unlikely to explain these early features. Peak shape alone is insufficient to distinguish staging from interfacial reactions.
Quick validation rule:
- If peaks disappear in the second cycle: Its disappearance is consistent with a first-cycle-specific process, but does not by itself prove a chemical reaction or identify SEI products. Comparable voltage windows, electrode states, and processing are required.
6. Why 0.02C Low-Rate Testing Helps (And How It Can Mislead)
Low current like 0.02C reduces cell polarization and resolves closely spaced weak reaction peaks that vanish at higher formation rates.
Tradeoffs of low-rate testing:
- Longer test duration amplifies time-dependent parasitic reactions
- Tester current offset becomes more significant relative to tiny applied current
- Dense voltage sampling can create unstable derivatives if voltage increments approach instrument noise or quantization limits
Use low C-rate as a diagnostic tool. Do not treat 0.02C dQ/dV behavior as identical to production formation conditions.
7. Practical Workflow to Validate Peak Origins
Follow this step-by-step workflow to prove what each dQ/dV peak represents:
- Build a repeatable baseline Keep electrode batches, loading, drying, electrolyte amount, wetting time, temperature, fixture conditions, and charging protocol consistent. Save raw data and log all processing parameters.
- Test processing robustness Try multiple smoothing and voltage bin settings. Confirm peaks still exist without relying on one narrow processing recipe. Do not differentiate directly across rest periods or unrelated program steps.
- Run controlled electrolyte screening Test baseline, blank base electrolyte and single-additive formulations. Record additive concentration basis, salt concentration, solvent ratio, moisture, and storage history. An “additive-free” electrolyte still contains reactive salt and solvents; it is a control formulation, not an electrochemically inactive blank.
- Separate anode / cathode signals Graphite/Li and NMC/Li half-cells help establish electrode-specific behavior. However, lithium counter electrodes, electrolyte excess, and different cell geometries can alter the observed response. Use half-cells as supporting evidence. A properly designed and validated three-electrode full cell can track electrode potentials during formation more directly than estimates based on full-cell voltage alone.
- Test surface & impurity variables Compare different graphite batches, copper surface treatments, and controlled moisture conditions. Measure the relevant material property rather than relying only on the nominal preparation condition. For example, an initial water addition does not guarantee that the same amount remains chemically available after electrolyte storage.
- Add independent chemical evidence Combine dQ/dV electrochemistry with surface characterization, electrolyte analysis or gas measurement for solid conclusions.
8. What Peak Area Can and Cannot Tell You
Integrate dQ/dV over voltage range to calculate total charge passed in that window: \(\Delta Q= \int_{V_1}^{V_2}\frac{dQ}{dV}\,dV\)
What peak metrics tell you
- Peak position: shifts in reaction voltage window
- Integrated charge: charge passed within the selected voltage interval, potentially including both reversible storage and irreversible reactions.
Limitations
- Peak area cannot directly quantify additive consumption, because multiple overlapping reactions contribute charge
- A larger formation peak does not guarantee better SEI; it may simply mean more parasitic side reactions
9. Apply dQ/dV Insights to Optimize Formation & Formulation
Use dQ/dV fingerprint peaks to compare electrolyte formulas and formation protocols. Link peak differences to real cell performance metrics:
- Initial Coulombic efficiency
- Gas generation and electrode swelling
- Impedance growth
- Long-term cycling stability
Canrud provides coin cell, pouch cell electrochemical testing and material evaluation services for battery R&D teams.
Conclusion
Small low-voltage peaks on first-charge dQ/dV curves give powerful clues for formation and SEI research, but full-cell voltage alone cannot identify individual chemical reactions.
Always start with raw data quality checks, map signals to electrode potentials, and validate competing hypotheses with controlled variable experiments. The practical value of dQ/dV analysis lies in connecting reproducible electrochemical peaks to proven interfacial behavior and final cell performance.
FAQ
Q1: Does the 2.5 V full-cell peak always prove VC or FEC reduction?
A: No. This assignment is plausible only for known electrolyte formulations. Peak position depends on both electrodes and test polarization.
Q2: Can a repeatable dQ/dV peak still be a measurement artifact?
A: Yes. Fixed tester program steps and identical smoothing settings can create stable false peaks. Always inspect raw time-series data.
Q3: If a peak disappears after the first charge, does that confirm SEI formation?
A: No. Its disappearance is consistent with a first-cycle-specific process, but does not by itself prove a chemical reaction or identify SEI products. Comparable voltage windows, electrode states, and processing are required.
Q4: Is 0.02C the best C-rate for formation dQ/dV analysis?
A: It is one powerful diagnostic rate, not a universal standard. Select C-rate based on test goal, instrument accuracy and required peak resolution.
منتجات وخدمات ذات صلة
استخدم منتجات Canrd وخدمات البحث والتطوير لتحويل معرفة البطاريات إلى تجارب عملية.
علبة coin cell
منتجعلب coin cell للتحقق من المواد والمفاهيم الكهروكيميائية المذكورة في المقالة.
استخدم علب coin cell في اختبارك التالي →إلكتروليت الصوديوم
فئةإلكتروليتات لأبحاث بطاريات الصوديوم-أيون واختبارات التوافق والتحقق من الخلايا.
تصفح إلكتروليت الصوديوم للتحقق →تصنيع الخلايا
خدمةاحصل على دعم لبناء خلايا جافة أو مجمعة أو صيغ مخصصة للتحقق في البحث والتطوير.
اطلب دعم تصنيع الخلايا →مواد تجريبية
فئةتصفح مواد للتجارب اللاحقة والمقارنة وتطوير المنتجات.
تصفح مواد البطاريات التجريبية →
