

 contact@canrd.com
 +86 18928276992
Graphitization Degree of Graphite: How to Calculate from XRD
Graphitization degree is a core structural metric for battery researchers to compare interlayer-spacing-based structural order of synthetic graphite anode materials. Minor errors in diffraction angle measurement can greatly skew final calculation results. Importantly, a higher graphitization degree does not directly equal longer cycle life or superior fast-charging performance.
This article introduces how to calculate graphite graphitization degree from XRD data, explains selection rules for (002) and (004) diffraction peaks, and guides you to interpret results together with other anode quality indicators. It also links graphite structural characterization to CANRD’s end-to-end material-to-cell evaluation workflow.
What Is Graphitization Degree?
Graphitization refers to the structural ordering transformation of non-graphitic carbon into ordered graphite under high-temperature heat treatment. Commercial synthetic graphite usually adopts graphitizable coke as raw material. Different carbon precursors show varied responses to thermal treatment, and not all disordered carbon can form well-ordered graphite merely by heating.
Graphite features hexagonal carbon networks stacked layer by layer, and it cannot be simply defined as a hexagonal close-packed structure.
For ideal hexagonal graphite reference:
- In-plane lattice parameter a ≈ 0.2461 nm
- Stacking direction lattice parameter c ≈ 0.6708 nm
- Interlayer spacing d002 = c/2 ≈ 0.3354 nm
The widely adopted XRD graphitization index evaluates how close the measured interlayer spacing is to the ideal graphite reference. It is a structural indicator, not a direct test of graphite purity, graphite mass fraction or overall battery performance.
Maire–Mering Formula for Graphitization Degree
The Maire–Mering formula, also called the Mering–Maire formula, is a widely used empirical relationship for estimating graphitization degree from interlayer spacing.
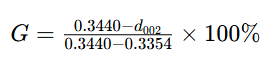
d002 unit: nanometer
| Parameter | Definition |
|---|---|
| G | Empirical graphitization index (%) |
| d002 | Interlayer spacing calculated from graphite (002) diffraction peak |
| 0.3440 nm | Disordered carbon reference spacing in this model |
| 0.3354 nm | Ideal graphite reference spacing in this model |
These two boundary values form an empirical scale, which cannot describe all types of turbostratic or amorphous carbon universally.
A graphitization degree of 93% does not mean the sample contains 93 wt% graphite. Even G=100% cannot rule out lattice defects, impurities or surface disorder.
Applicable Scope of the Formula
This formula is suitable for relative comparison of graphitizable carbon and graphite samples under unified test conditions. Avoid applying it to hard carbon, highly disordered carbon, multi-phase materials or composites where graphite peaks cannot be accurately assigned.
If your calculation outputs negative values or results over 100%, check instrument calibration, peak indexing, sample status and model applicability. Do not manually clamp results into the 0–100% range.
Calculate d002 from XRD Diffraction Peak
XRD outputs diffraction angle as 2θ. Bragg’s Law connects diffraction angle and interplanar spacing:
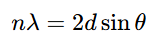
Take n=1 for (002) peak:
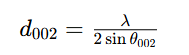
θ = half of measured 2θ angle.
For Cu Kα1 radiation, commonly used wavelength λ ≈ 0.15406 nm. Always use the wavelength matching your instrument optical setup and peak fitting model; never mix Kα1 wavelength with unprocessed Kα1/Kα2 doublet peaks.
Calculation steps:
- Identify and fit graphite diffraction peak
- Correct angular deviation with validated calibration method
- Divide corrected 2θ by 2 to get θ
- Compute d002 via Bragg’s law
- Substitute d002 into Maire–Mering formula
- Report test method and measurement uncertainty
Calculation Example
For an illustrative calculation, assume that a calibrated XRD analysis yields d002 = 0.3360 nm.

With λ=0.15406 nm, this d002 corresponds to (002) peak at ~26.507° 2θ.
| d002 / nm | Graphitization Degree G |
|---|---|
| 0.3354 | 100.0% |
| 0.3360 | 93.0% |
| 0.3370 | 81.4% |
| 0.3380 | 69.8% |
All values are calculation examples, not CANRD actual sample test data or product acceptance thresholds.
Why Small Peak Position Errors Cause Big Deviation
The denominator of Maire–Mering formula is only 0.0086 nm. A 0.0001 nm error of interlayer spacing will shift G by roughly 1.16 percentage points.
Near d002 = 0.3360 nm, an angular error of 0.02° in 2θ corresponds to an approximately 0.00025 nm error in d002, changing the calculated graphitization degree by about 2.9 percentage points. This estimation assumes fixed wavelength and only considers angular error.
Report precision based on your full measurement workflow. Extra decimal digits from analysis software do not represent higher accuracy.
(002) vs (004) Reflection: Which One to Choose?
For ideal hexagonal graphite lattice:

The graphitization formula can be rewritten using d004:

| Diffraction Peak | Advantages | Limitations |
|---|---|---|
| (002) | Often remains measurable in less ordered graphitic materials | Broad scattering from disordered carbon interferes peak fitting |
| (004) | Higher diffraction angle reduces relative spacing error | Weak peak intensity; peak overlap and Kα doublet affect precision |
The advantage of high-angle peaks comes from Bragg’s law: for fixed angular error, relative error of d-spacing is approximately proportional to cotθ.
The (004) reflection can be useful when it is sufficiently resolved and provides adequate counting statistics. Its suitability depends on signal quality, peak overlap, calibration, and the analysis model rather than graphitization degree alone. If both peaks are available, compare calculated c parameters for cross verification.
XRD Test Practices to Improve Result Reliability
Apply certified position reference
Certified silicon powder standard is widely used to calibrate angular offset. High chemical purity alone cannot make powder a diffraction reference standard.
For Cu Kα1, Si (111) peak locates near 28.44° 2θ, close to graphite (002) peak. The quoted 28.443° must be used together with corresponding wavelength and reference conditions, not treated as universal fixed value.
Record reference material information and sample mixing method. A single nearby calibration peak can only provide local correction and does not by itself establish correction of all angle-dependent errors across wide scanning range.
Verify sampling and counting parameters
Set step size and scanning speed to fully resolve peaks and provide adequate counting statistics.
Scanning speed slower than 2°/min may be a suitable starting point for some conventional instruments, but not a mandatory standard. Detector type, optical path, peak width and counting time all affect data quality.
Validate your method via standard sample tests, repeated scans and re-packed samples. Reducing scan speed cannot fix sample height displacement or inappropriate peak fitting model.
Control sample preparation conditions
Keep sample height, packing density and surface state consistent in every test. Severe preferred orientation changes peak intensity and damages comparability, especially for coated electrode samples.
Distinguish samples: raw graphite powder, coated electrode, or material harvested after cycling. Lithiation state and sample recovery procedure alter graphite crystal structure. Do not directly compare results from different sample states.
Mix silicon internal standard with separate powder aliquots, avoid contaminating raw material reserved for electrode manufacturing.
Match peak fitting to instrument configuration
If Kα1 and Kα2 peaks coexist, use validated methods including doublet profile fitting or Kα2 stripping. Monochromatic Kα1 data needs no Kα2 subtraction.
Do not apply overlapping corrections without checking software fitting model. Background selection, peak asymmetry and adjacent diffraction peaks will shift fitted peak positions.
Midpoint at half peak height can be adopted when specified in standard methods, but it is not always better than fitted peak position. For broad or overlapping peaks, document fitting model and check how analysis parameters affect final results.
Interpret broad carbon scattering signals carefully
Broad hump near graphite (002) region can reflect stacking disorder or small coherent domains, or combined effects. It cannot be simply regarded as independent amorphous carbon phase.
If fitting separates broad and sharp components, their peak area ratio cannot directly calculate amorphous/crystalline mass fraction without validated quantitative analysis.
Higher Graphitization Degree ≠ Better Anode Electrochemical Performance
Higher structural ordering brings desirable graphite properties, but graphitization degree cannot independently predict cycle life, initial Coulombic efficiency or fast charging capability.
Particle morphology, surface coating, BET specific surface area, electrode orientation, porosity, electrolyte compatibility, and formation conditions also influence performance. Their relative importance depends on the material and cell design.
For fast charge research, test lithium plating and charge acceptance under target temperature and electrode loading. For cycle life evaluation, run full cell tests rather than inferring performance only from structural parameters.
Material benchmarking needs to combine graphitization degree with powder processability and electrochemical test data.
Graphitization Degree, Coherent Stacking Height Lc and Orientation Index
These three indicators characterize different structural features of graphite.
| Indicator | What it describes | What it cannot prove alone |
|---|---|---|
| Graphitization degree | Layer-spacing-based structural order calculated by empirical d-spacing model | Graphite purity, cell cycle lifespan |
| Coherent stacking height L_c | Coherent diffraction-domain extent along the stacking direction, estimated using an appropriate line-broadening model | Actual powder particle size |
| Orientation Index (OI) | Crystal preferred orientation under defined measurement rules | Graphitization degree |
Instrumental broadening and other contributions, such as strain and stacking disorder, should be considered when interpreting peak widths.
Definitions of OI vary widely. In reports, you must specify diffraction peaks, intensity/integral area ratio, normalization rules and sample geometry. OI tested from powder and coated electrode cannot be directly compared.
Raman spectroscopy provides complementary disorder information. Raman D/G ratios and XRD-derived graphitization indices probe different structural features. They should not be converted directly into one another. Any empirical correlation must be validated for the specific material family, excitation wavelength, and analysis procedure.
Practical Graphite Anode Evaluation Workflow (CANRD Framework)
CANRD’s material evaluation system connects powder characterization, slurry processing, electrode fabrication and cell performance testing. The workflow for graphite anode development:
- Define application specification and test baseline. Confirm graphite grade, sample state, XRD protocol and acceptance criteria.
- Powder characterization. Test graphitization degree alongside particle size, BET, tap density, impurity content, moisture and morphology.
- Electrode process assessment. Check slurry stability, coating uniformity, adhesion and calendering performance.
- Electrochemical characterization. Test reversible capacity and initial Coulombic efficiency with standardized mass normalization and identical test protocols.
- Full-cell validation. Evaluate rate capability and cycling performance with matched cathode and target electrolyte under practical working conditions.
Browse CANRD's anode materials for R&D for graphite powder selection. Our battery slurry mixing guide covers the subsequent electrode processing stage.
FAQ
Q: Is graphitization degree equal to graphite purity?
A: No. Graphitization degree reflects structural ordering based on empirical model. Purity requires chemical composition analysis.
Q: Can Maire–Mering formula be used for hard carbon?
A: It is not suitable as quality metric for hard carbon. Wide scattering and unique carbon structure lead to misleading calculation results.
Q: Must silicon standard be added in every XRD test?
A: Silicon internal standard helps improve accuracy for graphite peak position measurement. Other validated calibration methods are also acceptable. The core requirement is enough measurement accuracy for your comparison purpose.
Q: Does negative graphitization degree mean negative graphite content?
A: No. Negative value means measured interlayer spacing exceeds the disordered carbon boundary of this empirical model. You need to check measurement quality and model applicability.
Q: What is the ideal graphitization degree for battery graphite?
A: There is no universal threshold for all graphite grades and battery applications. Follow specs agreed by supplier and customer under fixed test method, and validate electrode and cell performance in actual cells.
Graphite Anode Structural Characterization Service by CANRD
A complete graphitization test report should include corrected peak 2θ, X-ray wavelength, d-spacing, calculation method, calibration steps and repeatability data.
CANRD provides battery material characterization, electrode prototyping and research cell evaluation services. Our material characterization and analysis services cover XRD testing for graphite graphitization degree and orientation index, bridging microstructural features and battery development.

