

 contact@canrd.com

 +86 18928276992
XRD Peak Shift: Why Peaks Move Left or Right & How to Fix It
Canrd October 24, 2026 165
X-ray diffraction (XRD) is a core characterization technique for lithium-ion battery materials. Researchers use it to identify crystalline phases, calculate lattice parameters and track structural changes induced by synthesis or electrochemical cycling. A common observation is diffraction peaks shifting to higher or lower 2θ angles.
Peak position comparison alone cannot distinguish true structural changes from measurement artifacts. Variations in interplanar spacing, elemental composition, residual strain, phase transitions, sample displacement, instrument calibration and data fitting can all alter peak positions. This article classifies sources of XRD peak shift and uses Cu-modified NCM cathodes as a case study for battery material researchers.
1. What Is XRD Peak Shift?
Peak shift refers to the movement of diffraction peaks along the 2θ axis, governed by Bragg’s law: nλ = 2d sinθ
- n: diffraction order
- Λ: X-ray wavelength
- d: interplanar spacing
- θ: Bragg angle
- 2θ: diffraction angle
| XRD Observation | Possible Interpretation |
|---|---|
| Peak shifts to lower 2θ | Increased interplanar spacing |
| Peak shifts to higher 2θ | Decreased interplanar spacing |
| Peak broadening | Reduced coherent crystallite domains, microstrain or other broadening effects |
| Peak intensity variation | Preferred orientation, phase fraction or sample preparation artifacts |
| New peaks emerge | Phase transformation or impurity formation |
| Peak splitting | Symmetry change or coexisting phases |
These are only preliminary guidelines. Apparent peak shifts from instrument or sample-position errors cannot be directly interpreted as crystal structure changes.
2. Origins of Peak Shift from Lattice Changes
Lattice parameter change is the primary source of genuine peak shift and depends on crystal symmetry and diffraction plane.
2.1 Lattice Expansion and Contraction
Layered NCM exhibits anisotropic lattice evolution: the in-plane lattice parameter a and out-of-plane parameter c change independently. Reflections like (003) and (104) can show different shift magnitudes and directions.
2.2 Residual Stress and Average Lattice Strain
Residual stress comes from synthesis, thermal treatment, mechanical processing and battery cycling. It creates elastic lattice strain and modifies interplanar distances. There is no universal rule that compressive stress always produces a peak shift to higher 2θ.
2.3 Microstrain
Average lattice strain shifts peak positions. Non-uniform microstrain broadens diffraction peaks and may introduce peak asymmetry depending on strain distribution. Peak position and peak width should be analysed together.
3. How Doping Can Cause XRD Peak Shifts
Doping can modify lattice parameters, but not all dopants create measurable lattice changes. Dopants affect ionic radius at crystallographic sites, transition-metal oxidation states, oxygen stoichiometry, cation ordering and lattice distortion.
The resulting lattice response depends on substitution site, oxidation state, coordination environment, charge compensation and crystal structure. For NCM, transition-metal oxidation states and Li/Ni mixing both affect refined lattice parameters. Peak shift alone cannot confirm dopant lattice occupancy or redox reactions.
XRD must be paired with complementary tests such as ICP/SEM-EDS, XPS, XAS, TEM/STEM and electrochemical characterization to build a complete evidence chain.
4. Case Study: XRD Peak Shift in Cu-Modified NCM Cathodes
Samples: NCM-0, NCM-0.5, NCM-1, NCM-2.
Table 1 Atomic mole percentage of metal elements
| Sample | Yes (%) | Co (%) | Mn (%) | With (%) |
|---|---|---|---|---|
| NCM-0 | 80.15 | 10.30 | 9.55 | 0 |
| NCM-0.5 | 80.98 | 10.53 | 8.30 | 0.19 |
| NCM-1 | 79.77 | 9.50 | 9.93 | 0.80 |
| NCM-2 | 79.34 | 9.39 | 9.79 | 1.48 |
Table 2 Rietveld-refined lattice parameters and fit quality
| Sample | a (A) | c (Å) | c/a | Rwp (%) | Rp (%) |
|---|---|---|---|---|---|
| NCM-0 | 2.8649 | 14.1735 | 4.9472 | 9.45 | 7.65 |
| NCM-0.5 | 2.8696 | 14.1944 | 4.9464 | 7.95 | 6.02 |
| NCM-1 | 2.8693 | 14.1871 | 4.9444 | 9.35 | 7.69 |
| NCM-2 | 2.8665 | 14.1792 | 4.9465 | 9.97 | 8.09 |
Note: Rwp and Rp are goodness-of-fit metrics for Rietveld refinement. These values do not independently validate the crystal structure model. Per IUCr Rietveld guidelines, R-factors are affected by background, counting statistics and model assumptions. Full evaluation requires lattice parameter uncertainties, residual plots and model validation.
4.1 Result Interpretation
The measured Cu content confirms the presence of Cu in the analyzed samples but does not establish its crystallographic location. Possible distributions include lattice incorporation, surface enrichment or Cu-containing secondary phases. Distinguishing these possibilities requires additional structural and chemical characterization. Table 1 confirms Cu exists in the samples but cannot independently prove Cu substitutes for Ni, Co or Mn sites within the NCM lattice.
The reported lattice parameters show a non-monotonic trend with increasing Cu content. However, the statistical significance of small differences, particularly between NCM-0.5 and NCM-1, cannot be established without refinement uncertainties. These results should therefore be interpreted as trends in the reported values rather than definitive evidence of distinct lattice changes for every composition.
4.2 Analysis of (003) and (104) Reflections
Hexagonal rhombohedral NCM interplanar spacing formula:
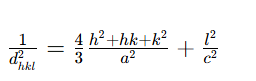
For (003): d_{003}=c/3
Based on the reported refined lattice parameters, the increased a and c values of NCM-0.5 are consistent with lower calculated 2θ positions for the (003) and (104) reflections compared with NCM-0, assuming identical X-ray wavelengths and measurement conditions. Direct confirmation of the observed peak shifts should be based on calibrated diffraction data and appropriate peak fitting.
4.3 Key Limitation
Lattice dimension changes do not independently prove Cu-induced Ni oxidation. Cation occupancy, oxygen deficiency, Li/Ni mixing and synthesis conditions all affect lattice dimensions. XPS or XAS is required to validate redox mechanisms. Cu modification correlates with non-monotonic lattice variation, but atomic-scale mechanisms need additional supporting evidence.
4.4 Refinement Quality
Rietveld reliability depends on crystal model, background treatment, profile fitting and constraints. Rwp and Rp must be evaluated together with parameter uncertainties when interpreting minor structural differences. Although the refined values exhibit a non-monotonic trend, the differences should be assessed against parameter uncertainties and possible systematic errors. In particular, the small change in the a parameter between NCM-0.5 and NCM-1 should not be overinterpreted without additional refinement information. Rietveld studies note statistical precision does not equal parameter accuracy; systematic errors may make real uncertainties larger than software-reported values.
5. Instrument-Related Apparent Peak Shifts
- Goniometer zero-point error: creates nearly constant 2θ offset across peaks. Use certified reference materials (Si, corundum) for calibration. Differentiate global calibration drift from sample displacement effects.
- Sample height / displacement error (Bragg-Brentano geometry): Peak shift relation: Δ(2θ)≈−(2h/R)cosθWhere h = sample height offset, R = goniometer radius, angles in radians. Sign depends on height convention and instrument geometry.Angle-dependent peak shifts may originate from specimen displacement, instrumental geometry or genuine lattice changes. In Bragg-Brentano geometry, specimen displacement produces a characteristic angular dependence. Therefore, calibration standards, specimen positioning and multi-peak lattice refinement should be evaluated together before assigning the cause.
- Wavelength mismatch: never directly compare 2θ from different X-ray sources; convert to d-spacing.
Poor peak fitting, peak overlap, detector and optical artifacts can also distort fitted peak positions.
Temperature Effects on XRD Peak Positions
Temperature changes can alter lattice parameters through thermal expansion or contraction. For anisotropic materials such as layered NCM cathodes, different crystallographic directions may exhibit different thermal responses. Temperature-induced phase transitions can also produce peak shifts, splitting or new reflections. Researchers should maintain consistent measurement temperatures and distinguish thermal effects from compositional or electrochemical structural changes.
6. Sample Preparation Errors
Excessive grinding introduces defects and strain. Non-uniform powder packing causes repeatability issues. Surface contamination or secondary phases may shift apparent peak positions. For ex-situ electrode samples, current collector, binder and texture signals must be considered.
Does Preferred Orientation Cause XRD Peak Shift?
Preferred orientation, also known as texture, primarily changes the relative intensities of diffraction peaks rather than their intrinsic Bragg positions. It is common in layered cathode powders and coated electrodes. If both peak intensity and position change, researchers should independently evaluate lattice strain, specimen geometry, overlapping reflections and peak-fitting artifacts.
7. Common XRD Analysis Mistakes
- Relying on auto peak search on noisy raw data without manual fitting validation
- Comparing reflections from different crystallographic planes or phases
- Confusing peak broadening (crystallite size / microstrain) with peak shift
- Over-interpreting tiny peak shifts without uncertainty analysis
- Treating Rietveld refinement output as direct proof of chemical mechanism
8. Troubleshooting Workflow for Unexpected Peak Shift
- Verify instrument settings, wavelength and scan parameters
- Calibrate instrument with certified reference standards
- Inspect sample preparation, packing and sample height
- Diagnose peak shift pattern: check whether Δ2θ varies with diffraction angle
- Perform Rietveld refinement or peak fitting on multiple reflections
- Deploy complementary characterization to validate structural hypotheses
- Repeat tests to confirm trends are reproducible within measurement uncertainty
FAQ
Q1: What does a peak shift to lower 2θ mean?
A: It generally corresponds to larger interplanar spacing. It can come from lattice expansion, strain or measurement artifacts.
Q2: Can peak shift prove successful doping?
A: No. Peak shift is only supporting structural evidence. Elemental and local structure characterization is required to confirm dopant location.
Q3: How to separate sample displacement error from real lattice change?
A: Angle-dependent peak shifts can arise from specimen displacement, instrument geometry or true lattice changes. Combine reference material calibration, sample positioning inspection and multi-peak lattice refinement to judge the root cause.
Q4: Does preferred orientation lead to peak shift?
A: Preferred orientation mainly modifies peak intensities and does not alter intrinsic Bragg peak positions. Concurrent changes in peak position and intensity require separate evaluation of strain, peak overlap and fitting bias.
Conclusion
XRD peak shifts provide valuable insights into battery material structural evolution, but conclusions cannot rely only on peak movement direction. Observed peak shifts may come from true lattice changes, residual strain, phase transitions or measurement artifacts.
The Cu-modified NCM example illustrates that Rietveld lattice refinement delivers deeper information than simple peak shift observation. XRD alone cannot confirm dopant lattice site or redox behaviour. A robust workflow combines instrument validation, calibrated diffraction data, structural refinement and complementary characterization.
Previous
Coin Cell Cycle Life...
