

 contact@canrd.com
 +86 18928276992
Battery Formation SOC: How to Choose the Right Charge Endpoint
Battery formation builds the initial electrode-electrolyte interfaces governing cell efficiency, internal resistance, storage stability and cycle life. Together with charging current, temperature and fixture pressure, the formation charge endpoint is a core variable for process development.
How much charge should a fresh cell receive before moving to the next manufacturing operation? Should the endpoint be controlled by charge input, voltage, time or combined triggers?
Based on CANRD’s formation training and cell validation framework, this guide explains how to define formation charge targets, assess their impacts and establish a practical operating window for lithium-ion cells.
1. What Is Formation Charge Fraction
In manufacturing, formation SOC commonly refers to charged capacity expressed as a percentage of a reference cell capacity:

The reference value can be design or nominal capacity.
This percentage works well as a production control setpoint, but it should not be automatically equated to true electrochemical SOC during first charge. Part of the input charge feeds irreversible reactions such as SEI growth. Initial electrode states and the selected reference capacity both change the relationship between charged capacity and recoverable stored lithium.
For technical precision, this article uses formation charge fraction when referring to programmed charge-input targets.
Always specify your capacity reference. The same percentage yields different absolute charge for different baseline capacities.
| Reference Capacity | Formation Charge Fraction | Target Charge Input |
|---|---|---|
| 1 Ah | 70% | 0.70 Ah |
| 5 Ah | 70% | 3.50 Ah |
| 25 Ah | 70% | 17.50 Ah |
| These are calculation examples, not recommended formation recipes. |
A percentage value alone never defines a complete formation process.
2. Why Formation Charge Endpoint Is Critical
For graphite-anode lithium-ion cells, formation forms a protective solid electrolyte interphase (SEI) via electrolyte reduction at the negative electrode. A high-performance SEI suppresses ongoing electrolyte decomposition while maintaining lithium-ion transport. Its quality depends on composition, surface coverage, mechanical stability and ionic transport properties — not thickness alone.
Adjusting the charge endpoint modifies the entire electrochemical history of the cell:
- Electrode lithiation state: Different endpoints create different degrees of cathode delithiation and anode lithiation, altering electrode potentials and subsequent side reactions.
- Interfacial reaction history: Longer charging keeps electrodes within specific potential windows for extended time. A higher charge fraction does not guarantee a thicker or better SEI.
- Gas generation & stack contact: Formation gas changes local electrode contact and cell thickness; outcome depends on stack pressure, fixture design and degassing workflows.
- Downstream manufacturability: The endpoint must match subsequent steps: rest, degassing, sealing, conditioning and capacity grading.
The goal is to define a stable process window, rather than simply maximizing or minimizing material characterizationharge input.
3. CANRD Integrated Formation Framework
Formation parameters interact tightly; no single variable can be optimized in isolation.
| Variable | Core Development Question |
|---|---|
| Initial charging current | Does it create suitable interfacial passivation without excessive polarization? |
| Subsequent charging current | Can cycle time be shortened while preserving cell performance? |
| Temperature | Is cell temperature uniform and well-controlled? |
| Fixture pressure | Are electrode contact and mechanical restraint appropriate? |
| Charge endpoint | Does the cell reach a suitable state for downstream processing? |
| Electrolyte formulation | Are solvents, salts and additives compatible with the formation sequence? |
| Cutoff voltage | Does termination logic remain valid at selected current and temperature? |
CANRD pouch cell training references a formation charge fraction range of 66%–83%, linked to cell thickness and electrode flatness. This range only applies to that specific training setup. It cannot be used as universal specs for LFP, NMC or silicon-anode cells. New cell designs require independent endpoint validation.
4. Charge, Voltage and Time: Distinct Termination Controls
A formation segment can terminate by accumulated charge, cell voltage, elapsed time, current taper under CV, or multi-condition logic.
| Control Type | Definition | Key Limitation |
|---|---|---|
| Charge input | Total charge passed through cell | Includes charge consumed in irreversible reactions |
| Voltage | Terminal cell voltage at cutoff | Affected by electrode state, polarization and resistance |
| Time | Programmed segment duration | Cannot guarantee fixed charge if current drifts |
| Current taper | CV-stage termination | Depends on voltage threshold and cell response |
For constant current segments:
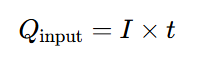
Multistage formation total charge:
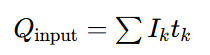
Use actual logged charge when voltage limits, pauses or interruptions occur. Even charge-controlled recipes must include validated voltage, temperature and time safety limits.
5. Voltage Endpoints Shift With Charging Current
Voltage features observed during formation change with charging rate. At higher current, polarization shifts the full-cell voltage signature. A voltage cutoff optimized at one C-rate corresponds to different charge input and reaction history under another current.
Use voltage-capacity curves and dQ/dV analysis to compare candidate recipes, and confirm final selection through full cell performance tests. Matching peak positions on differential capacity plots do not prove identical SEI composition or long-term stability.
6. Stepwise Endpoint Comparison Workflow
Stage 1: Screen candidate endpoints
Select charge targets around a validated baseline. Keep electrode batches, loading, N/P ratio, electrolyte volume, wetting, current profile, temperature and pressure consistent. Log real current, voltage, charge and cell temperature.
Stage 2: Separate time and charge effects
Extending CC charging to reach a higher endpoint changes both total charge and exposure duration. Matched-duration control groups help distinguish charge-endpoint effects from dwell time, though electrode potential histories will still differ.
Stage 3: Validate shortlisted recipes
Run replicate cells with standardized downstream tests. Report average performance plus sample variability. Good performance on a single cell or test channel does not equal a robust manufacturing process.
7. Key Metrics to Guide Recipe Selection
No single measurement should decide your formation endpoint. Use this complementary test matrix:
| Measurement | Evaluation Target | Interpretation Boundary |
|---|---|---|
| Charge / discharge capacity | Usable capacity and charge balance | Partial-cycle delta cannot uniquely quantify SEI lithium loss |
| Coulombic efficiency | Discharge-to-charge ratio for defined sequence | Must clearly define accounting boundaries |
| DCR | Resistance response under defined pulse | Depends on SOC, temperature, pulse duration and contact resistance |
| EIS | Frequency-dependent impedance response | Full-cell spectra contain overlapping electrode and transport contributions |
| Thickness & swelling | Mechanical behavior and gas evolution | Cannot identify gas species or root reaction source |
| Storage testing | Charge retention and capacity recovery | Requires fixed storage SOC, temperature and hold time |
| Cycling test | Long-term cell durability | Result tied to full cycling protocol |
| Electrode characterization | Surface and structural differences | Sample preparation and cell SOC alter observations |
8. Maintain Traceable Efficiency Calculations
Coulombic efficiency formula for a defined charge-discharge sequence:
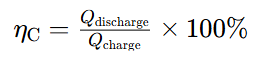
Always specify exactly which charge/discharge steps are included. Partial formation discharge, first full cycle and grading cycles produce different values because of different starting states.
Separate in your test report:
- Charge input of each formation stage
- Discharge after initial formation
- Post-formation conditioning cycles
- Capacity grading efficiency
- Cumulative charge balance
Higher initial coulombic efficiency is supporting evidence, but does not guarantee better interfacial stability or longer cycle life.
9. Interpreting DCR, EIS and Electrode Imaging
DCR
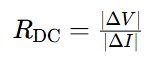
Define pulse direction, magnitude, duration and voltage sampling time. Compare cells at identical SOC, temperature and rest period. Lower DCR reflects different whole-cell response under test conditions; it does not prove SEI is the sole source of resistance change.
EIS EIS supports recipe screening, but full-cell Nyquist plots cannot automatically separate SEI impedance, charge transfer and solid diffusion. Reliable interpretation requires high-quality data, physically grounded modeling and supporting tests. Fitted semicircle size is not a direct measurement of SEI thickness.
Electrode imaging Surface SEM reveals morphological differences; optical inspection flags heterogeneous regions. Neither technique alone confirms SEI chemistry, thickness or irreversible lithium inventory loss.
Prepare separate sample sets: one for inspection at the as-formed endpoint, another for comparison after standardized conditioning. Additional charge/discharge can modify the interfacial layer you intend to study.
CANRD provides material characterization and failure analysis services for battery R&D: https://www.canrud.com/rd-services/material-evaluation/characterization-and-analysis
10. Optimize Formation Endpoint: Practical 6-Step Workflow
- Define objectives & acceptance criteria Prioritize targets: usable capacity, resistance, storage performance, cycle life, cell thickness or production throughput. Set measurable pass/fail criteria before starting tests.
- Document the reference recipe Record charge targets, currents, voltage limits, temperature, pressure, rest periods and downstream process steps.
- Design comparison matrix Start with a small endpoint sweep. Use DOE when exploring interactions of current, temperature and pressure.
- Standardize diagnostic conditions Equalize SOC and rest state before DCR, EIS, storage and cycling tests. Preserve dedicated as-formed teardown samples.
- Assess consistency Report sample count, mean value and data spread. Randomize cells across tester channels and retain raw logs.
- Lock in process window Validate top recipes across multiple batches or test runs. Factor formation duration, energy consumption, gas management and production yield into final selection.
CANRD’s cell performance testing supports capacity, resistance, storage and cycling validation: https://www.canrud.com/rd-services/material-evaluation/met-cellPerformanceTesting
Conclusion
Formation charge fraction shapes electrode lithiation, potential history and the evolution of critical solid-electrolyte interfaces.
CANRD’s validation framework treats the charge endpoint as one part of an interconnected process including current, temperature, stack pressure, electrolyte and post-formation conditioning.
Historical percentage ranges serve only as starting references. The optimal formation recipe must be validated for your specific cell design, materials and performance goals.
FAQ
Q1: Is formation SOC the same as charged capacity divided by design capacity?
A: This ratio is a practical charge-input setpoint. During first charge, irreversible side reactions mean it should not automatically equal true electrochemical SOC.
Q2: Does CANRD recommend a fixed formation SOC for all lithium-ion cells?
A: No. The historical training range is limited to its original test setup. New cell builds require validation matched to their materials and performance targets.
Q3: Does higher formation charge always improve SEI quality?
A: No. The final result depends on electrode potential, dwell time, temperature, electrolyte chemistry and existing passivation.
Q4: Can I select the endpoint based only on voltage?
A: Voltage is valuable but incomplete. Combine it with charge input, current, time and cell response. The recipe must define full termination logic.
Q5: What combination of tests delivers the most reliable results?
A: Combine capacity and coulombic efficiency, standardized DCR/EIS, thickness tracking, storage aging and cycle testing. Add material characterization only when mechanistic root-cause explanation is required.
Q6: Can coin-cell formation recipes directly transfer to pouch cells?
A: No. Cell geometry, electrolyte loading, contact pressure and gas handling differ significantly. Coin cells work for material screening; pouch cells need separate process validation.

